
Figure 6.
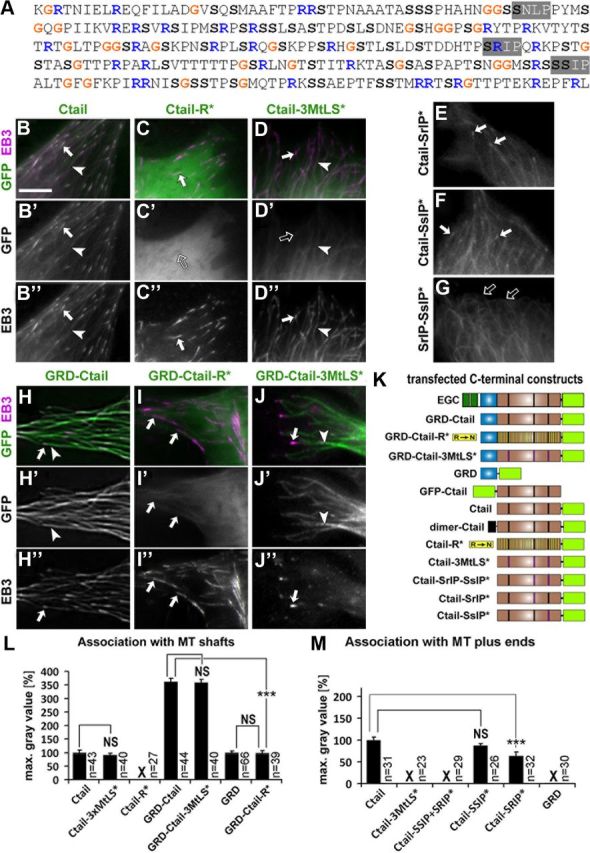
Association to MT shaft or plus end is determined by positive charge and MtLS motifs in the Ctail. A, Sequence of Ctail (Ensembl ID: FBpp0086744) illustrating the distribution of glycines (G), arginines (R) and serines (S), and the location of the three putative MtLS motifs (highlighted in gray). B–J″, Stills taken from live movies of fibroblasts expressing Shot domain constructs (as indicated); arrows point at MT plus end localization of GFP-constructs and/or EB3::RFP, open arrows indicate lack of MT plus end localization, and arrowheads show association along MT shafts; E–G, Ctail constructs with mutations of only subsets of their MtLS motifs imaged in the absence of additional markers showing that EB3 coexpression had no obvious impact on the localization of GFP-tagged constructs. K, C-terminal constructs of Shot that were analyzed in fibroblasts. L, M, Quantification of construct associations with MT shafts or MT plus ends; X indicates absence of any detectable association; Statistics were performed using Kruskal–Wallis one-way ANOVA on Ranks (H = 320.309 with 5 degrees of freedom, p ≤ 0.001 in H; H = 19.104 with 2 degrees of freedom, p ≤ 0.001 in I) and Mann–Whitney rank sum test (***p ≤ 0.001; NS, not significant; p > 0.05). Scale bar in B, 4 μm in all images.