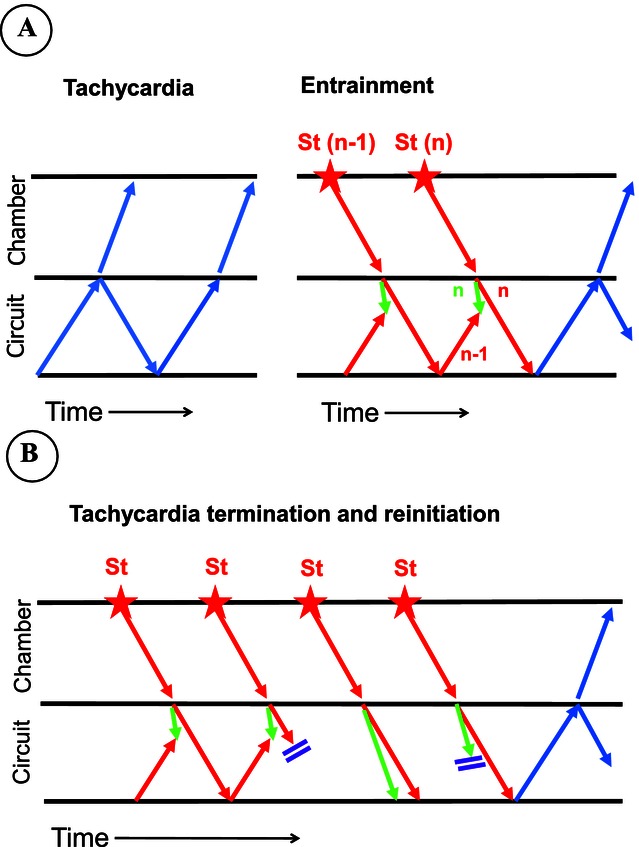
Figure 3.

Activation during tachycardia and during pacing is schematically depicted in a ladder diagram format with time as the X-axis. The tissue is schematically divided into the reentrant circuit (“circuit”) and the remaining of the chamber (“chamber”). Panel A represents activation during tachycardia (left) and during the last two beats (n – 1 and n beats) of a pacing train, introduced at a distance from the chamber, producing entrainment (right). Blue arrows represent activation during tachycardia in an ondulating format to represent circular continuous activation. During entrainment, each paced wavefront (St) propagates through the intervening tissue (red arrow in chamber). As it enters the circuit, it generates an orthodromic wavefront (red arrows in the circuit) and an antidromic wavefront (green arrows in the circuit); the latter collides with the activation resulting from the orthodromic wavefront of the previous paced beat (“n green” collides with “n – 1 red”). Please note that, during entrainment, all the tissue within the reentrant circuit is accelerated at the pacing cycle length despite conduction velocity being the same as during tachycardia. See text for further discussion. Panel B represents pacing-induced tachycardia termination and reinitiation. Tachycardia terminates in the second beat due to block of the orthodromic wavefront inside the circuit. The fourth paced impulse blocks in the antidromic direction so tachycardia reinitiates. If pacing would have been stopped after the second or third paced impulse, the tachycardia would have been terminated, but as it is stopped after the fourth beat, the tachycardia continues. Please note that despite activation of the intervening tissue (“chamber”) at the pacing rate, some areas of the reentrant circuit are not activated at that rate.
