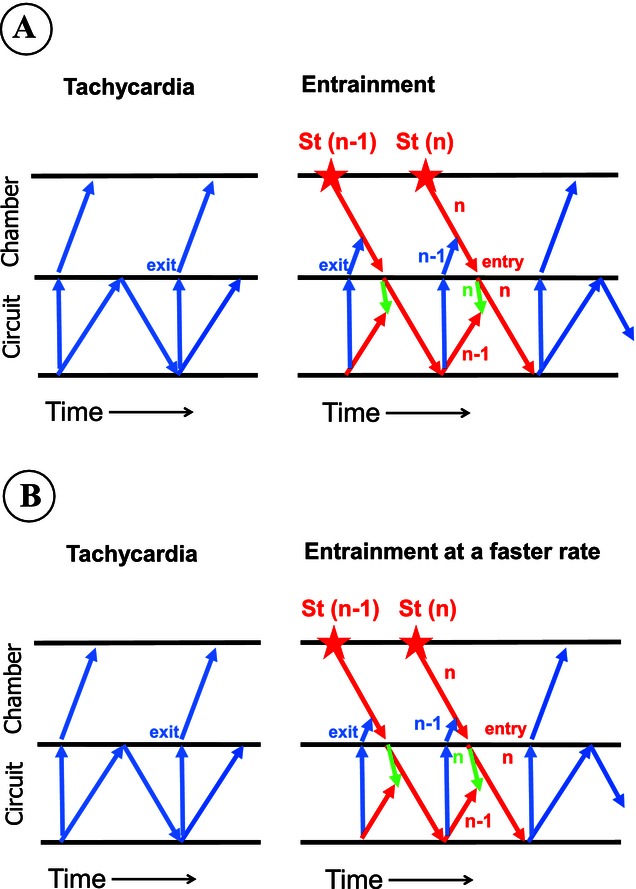
Figure 9.

Schematic representation of entrainment with electrocardiographic fusion in a ladder diagram. The format in both panels is similar to that of Figure 3A, but the exit from the tachycardia is now depicted as a “tunnel-like” structure from the circuit, to allow the representation of fusion in a 1-dimensional scheme (in the right panel). Note that fusion in the activation of the chamber occurs because activation resultant from the “n – 1” paced wavefront, as it exits orthodromically from the circuit, is coincidental in time with the “n” paced wavefront. The comparison of panel A with panel B illustrates progressive fusion. As the pacing rate increases (panel B), since each paced wavefront is generated sooner after the previous impulse, more myocardial mass of the chamber will be activated by the paced wavefront and less due to the exiting wavefront from the tachycardia, so the degree of fusion will change, and this will be reflected in the electrocardiogram. Please also note that the antidromic wavefront in the circuit will also invade a greater proportion of the tissue in the circuit.
