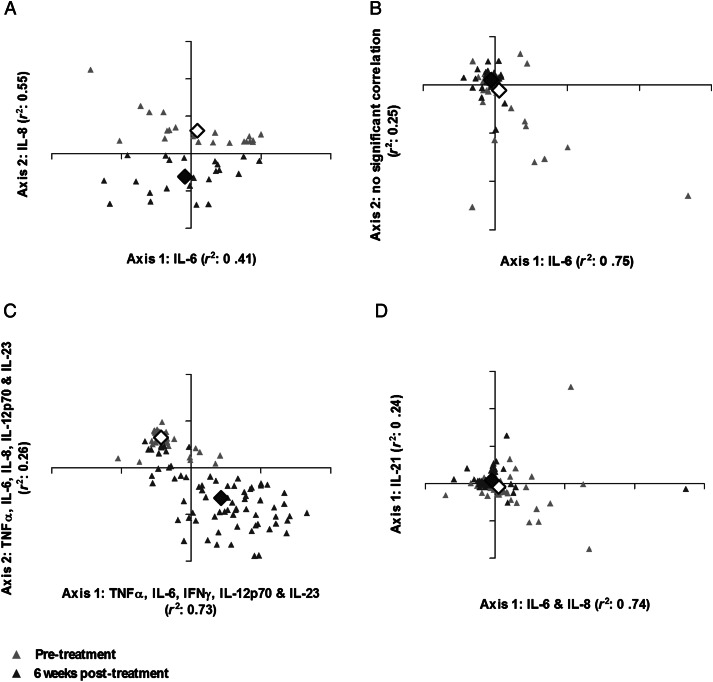
Figure 2.
Cytokine profiles elicited by Schistosoma haematobium cercariae (CAP) (A), adult worm (WWH) (B), and egg (SEA) (C) antigens and spontaneous cytokine production (D) differed 6 weeks post-treatment relative to pretreatment responses. Nonmetric multidimensional scaling ordination plots of participants' combined cytokine responses (interferon γ [IFN-γ], tumor necrosis factor α [TNF-α], interleukin 2 [IL-2], interleukin 4 [IL-4], interleukin 5 [IL-5], interleukin 6 [IL-6], interleukin 8 [IL-8], interleukin 10 [IL-10], interleukin 12p70 [IL-12p70], interleukin 13 [IL-13], interleukin 17A [IL-17A], interleukin 21 [IL-21], and interleukin 23 [IL-23]) before (gray triangles) and 6 weeks after treatment (black triangles) plotted according to 2-dimensional spatial axes (CAP, n = 21; WWH, SEA, and unstimulated, n = 72). The proportion of variance in participant cytokine responses attributable to each axis (Pearson's r2) is shown. Axes are labelled according to the cytokines with which they are most strongly correlated (correlation coefficients for these associations provided in Supplementary Table 1). Axis 2 of the WWH-specific cytokine ordination plot was not strongly associated with any of the pre- or post-treatment cytokine responses assayed. Mean within-group differences reflect the total variation between participant cytokine responses before (white diamond) and after (black diamond) treatment.

