
Figure 6.
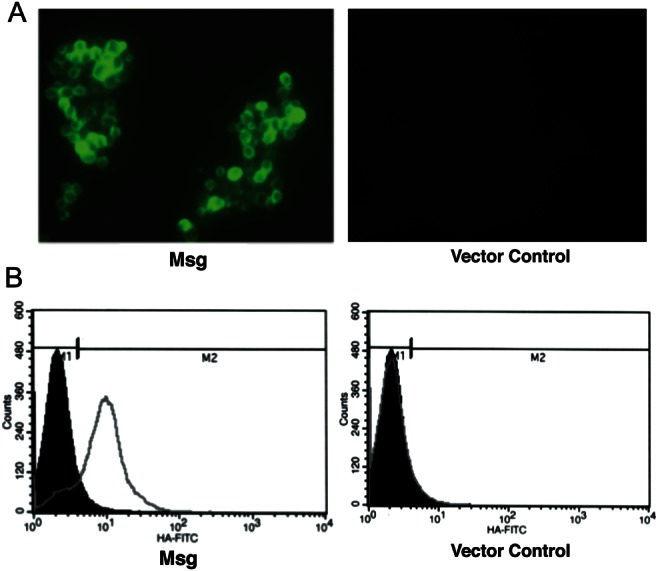
Improved cell surface expression of Msg fusion protein under the control of gal1 promoter. Construct 3 (Figure 4A) was cloned into pESC-URA vector downstream of the gal1 promoter. After 4 hours of galactose induction, the yeast transformants were analyzed for the cell surface expression of Msg by immunofluorescence, using fluorescein isothiocyanate–conjugated anti-hemagglutinin (HA) antibody. A, Immunofluorescence microscopic analysis. Cells transformed with the msg construct showed immunofluorescence, whereas cells transformed with vector alone showed no fluorescence. B, Flow cytometric analysis. The histogram shows the cell counts on the y-axis and fluorescence intensity on the x-axis. Solid histogram shows nonspecific staining with the negative control (mouse immunoglobulin G), and the open histogram shows specific staining with the anti-HA antibody. Approximately 84% of the cells showed surface expression of the Msg fusion protein; vector alone showed no staining.