
FIG. 5.
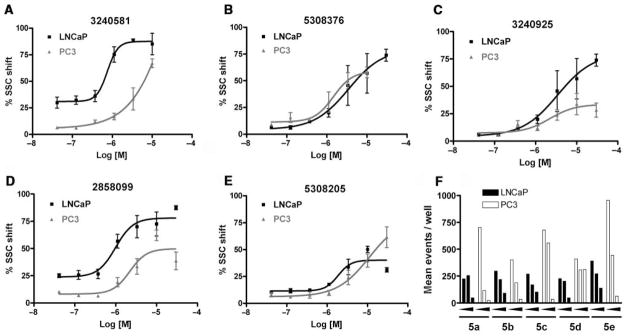
Dose-response curves of the best representative compounds from the 5 families discussed in Table 2. LNCaP (closed squares); PC3 (closed triangles). Methods were essentially as described for Figure 4 except that PC3 cells were seeded at 7500 cells per well. (A) LNCaP EC50 was 0.77 μM, and PC-3 EC50 was 6.5 μM. (B) LNCaP EC50 was 3.35 μM, and PC3 EC50 was 1.46 μM. (C) LNCaP EC50 was 3.45 μM, and PC3 EC50 was 2.21 μM. (D) LNCaP EC50 was 0.99 μM, and PC-3 EC50 was 2.21 μM. (E) LNCaP EC50 was 1.87 μM, and PC3 EC50 was 11.14 μM. (F) A composite graph indicating the event count observed when the cells were exposed to 3, 10, and 30 μM of the 5 compounds depicted in the graphs.