
Fig. 1.
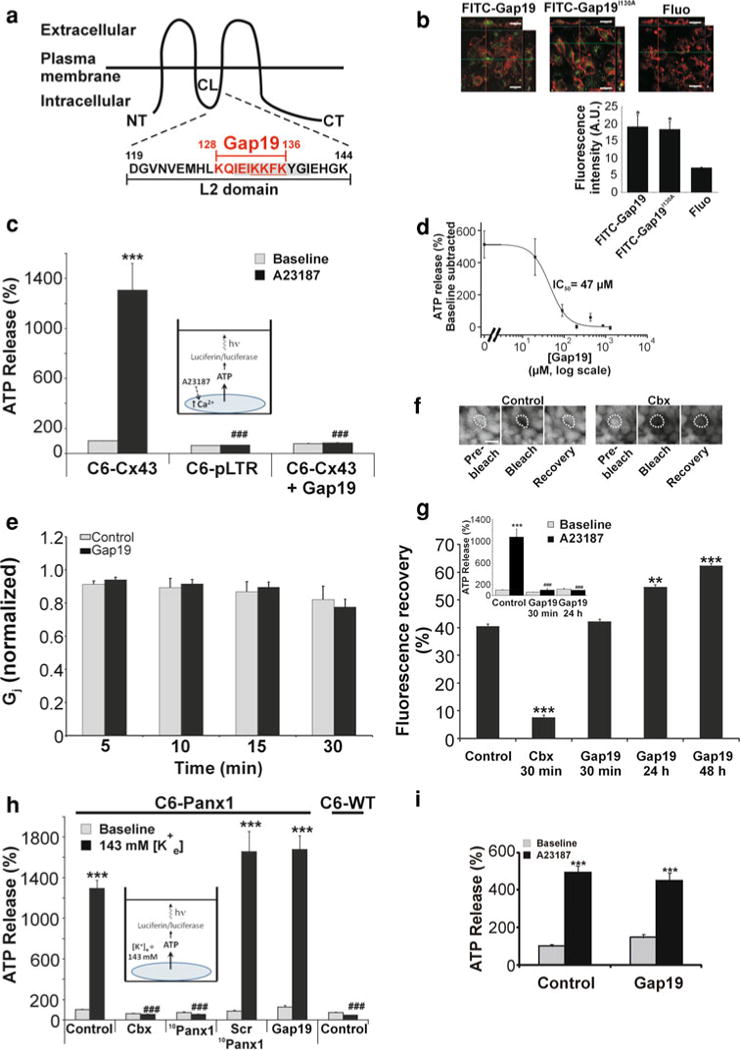
Gap19 inhibits [Ca2+]i-triggered ATP release in C6-Cx43 cells. a Topology of Cx43 and location of Gap19 in the L2 domain, part of the CL. The underlined sequence is a putative membrane translocation motif and the greyed zone is crucial for CT–CL interactions. b Confocal micrographs of C6-Cx43 cells, counter-stained for F-actin (red fluorescence), illustrating cellular uptake of fluorescein-labeled (green) Gap19 (FITC-Gap19), Gap19I130A (FITC-Gap19130A) and fluorescein only (Fluo). Scale bar is 20 μm. The bar chart below reports fluorescence intensities (A.U., arbitrary units) measured in the cells. Uptake of fluorescein-labeled peptides was significantly stronger as compared to fluorescein only (n = 4). Stars indicate significance compared to Fluo. c Inducing [Ca2+]i changes with the Ca2+ ionophore A23187 (inset shows experimental approach) triggered significant ATP release in C6-Cx43 but not in C6 cells stably transfected with the empty vector (C6-pLTR) (n = 12). Gap19 (200 μM, 30 min) strongly inhibited [Ca2+]i-triggered ATP release. d Gap19-inhibition of triggered ATP release was concentration-dependent (n = 6). e Junctional conductance (Gj) measurements in Cx43 expressing Novikoff cell pairs at different time points in the absence or presence of Gap19 (400 μM) in the recording pipette solution. Gj was normalized to the corresponding values at the beginning of the experiment. Gap19 had no effect on Gj (n = 4–16). f Representative images of a FRAP experiment in C6-Cx43 cells preloaded with CFDA. Images were acquired before photobleaching (pre-bleach), just after photobleaching the cell marked with the dotted line (bleach) and 5 min later to assess fluorescence recovery in the bleached cell. g Quantification of the fluorescence recovery 5 min after photobleaching: 30 min Gap19 (200 μM) had no influence while 24–48 h incubations promoted dye transfer (n = 5). Inset above illustrates that 24 h incubation with Gap19 inhibited ATP release equally strong as 30 min incubation (n = 12). h Exposure of C6-Panx1 cells to 143 mM [K+]e-triggered ATP release that was blocked by carbenoxolone (Cbx, 10 μM, 30 min) or 10Panx1 (200 μM, 30 min), and absent in C6-WT cells. Gap19 or Scr10Panx1 had no effect on high [K+]e-triggered ATP release (n = 12). i Gap19 (200 μM, 30 min) did not inhibit [Ca2+]i-triggered ATP release (brought about by 2 μM A23187 applied during 5 min) in HeLa-Cx40 cells (n = 6). Stars indicate statistical significance compared to the neighboring grey baseline bar (except in b); number signs mark comparisons to the black control bar; one symbol p < 0.05, two symbols p < 0.01, three symbols p < 0.001