
Figure 3.
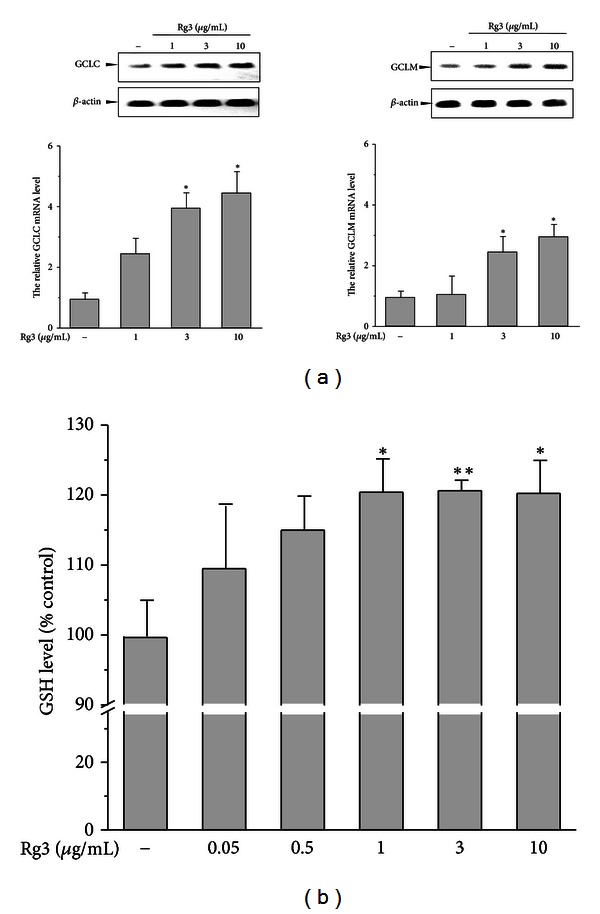
Effects of Rg3 on the GCLC and GCLM gene expression and GSH content. (a) The cells were treated with Rg3 (1–10 μg/mL) for 12 h. The representative blots of GCLC and GCLM mRNA were assessed by RT-PCR. Band intensities of gene products were quantified and normalized to β-actin. (b) The GSH level was determined in the cell homogenates with the indicated dose of Rg3 for 24 h. The value in the graph represents the mean ± S.E. with at least three separate experiments (*P < 0.05, **P < 0.01, significantly different from control).