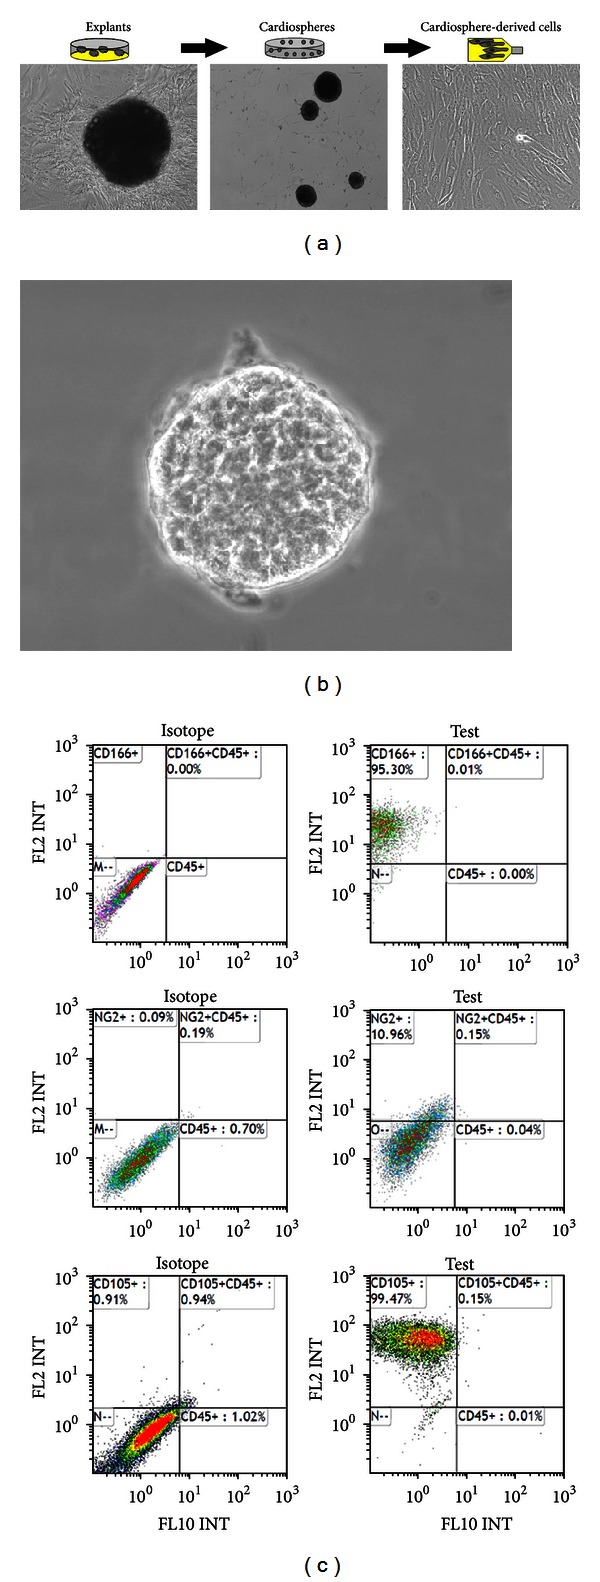
Figure 1.

(a) Photomicrographs of a human atrial appendage specimen in the primary culture giving rise to a cellular outgrowth (left panel); CSs (middle panel); CDCs (right panel). (b) High magnification view of a human CS. (c) Flow-cytometric analysis of cell-surface marker expression by CS-forming cells (top to bottom: plots for CD45 versus CD166, CD45 versus NG2, and CD45 versus CD105 expression).
