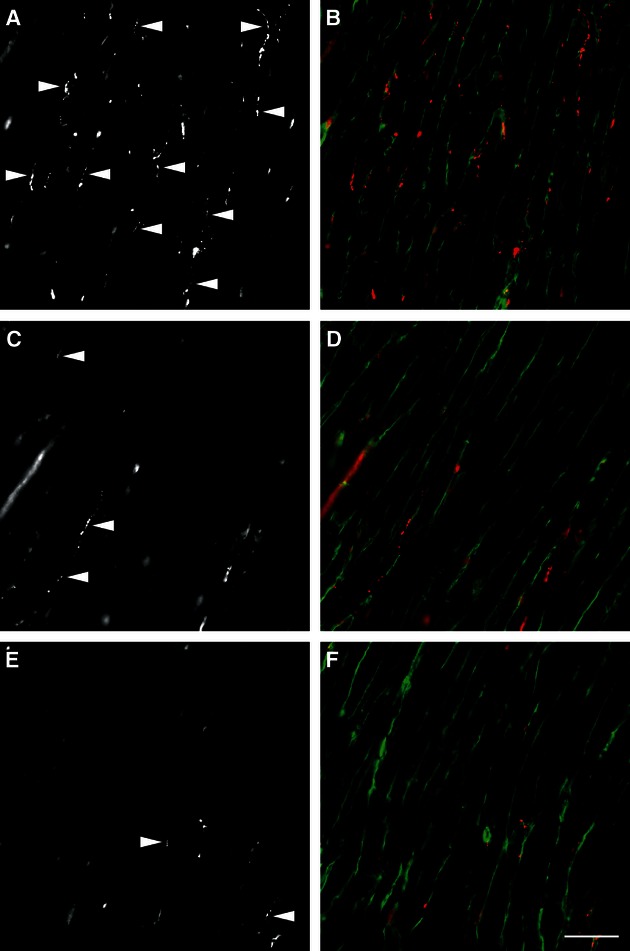
Fig 5.

Distribution of nerve fibres stained by immunohistochemistry. The nerve fibre density was decreased in both TAC groups (C, D: 1 week after TAC; E, F: 4 weeks after TAC) compared with sham (A and B). (A, C and E) PGP 9.5 staining only; (B, D and F) merged channels with red = PGP 9.5, green = wheatgerm agglutinin. Arrowheads in (A, C and E) label some PGP 9.5-positive neurons. Scale bar: 40 μm. Images were taken using a Zeiss Axiophot microscope.
