
FIG. 3.
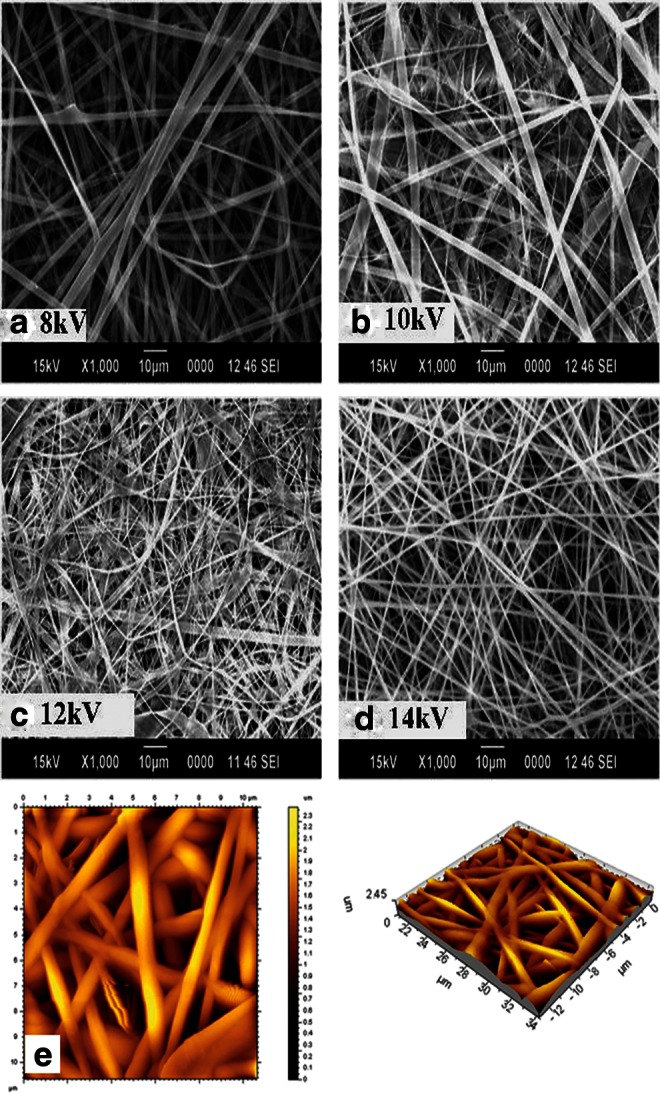
Representative scanning electron microscopy (SEM) images of the electrospun GeVAc using different voltage conditions: (a) 8 kV, (b) 10 kV, (c) 12 kV, and (d) 14 kV. (e) Noncontact atomic force microscopy image of the optimized GeVAc electrospun fibers showing height data and three-dimensional image showing the interconnectivities and pore structures on the scaffold.