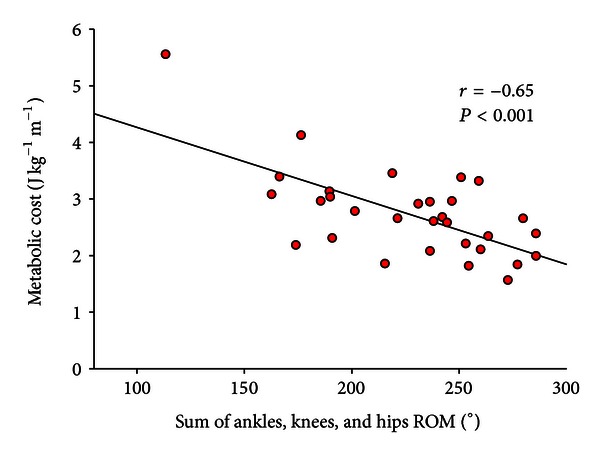
Figure 4.

Net metabolic cost in 31 patients with haemophilia as a function of the total ROM at ankles, knees, and hips levels. The dynamic ROM of the hip, knee, and ankle was calculated as follows: ankle: A3-A2 (A3-maximum plantar flexion at pushoff; A2-maximum dorsiflexion in stance); knee: K4-K3 (K4-maximum flexion in swing; K3-maximum extension at preswing); hip: H2-H1 (H2-maximum extension in stance; H1-flexion at initial contact). The ROM of lower limb joints were calculated for both sides and then summed. r = Pearson product moment correlation.
