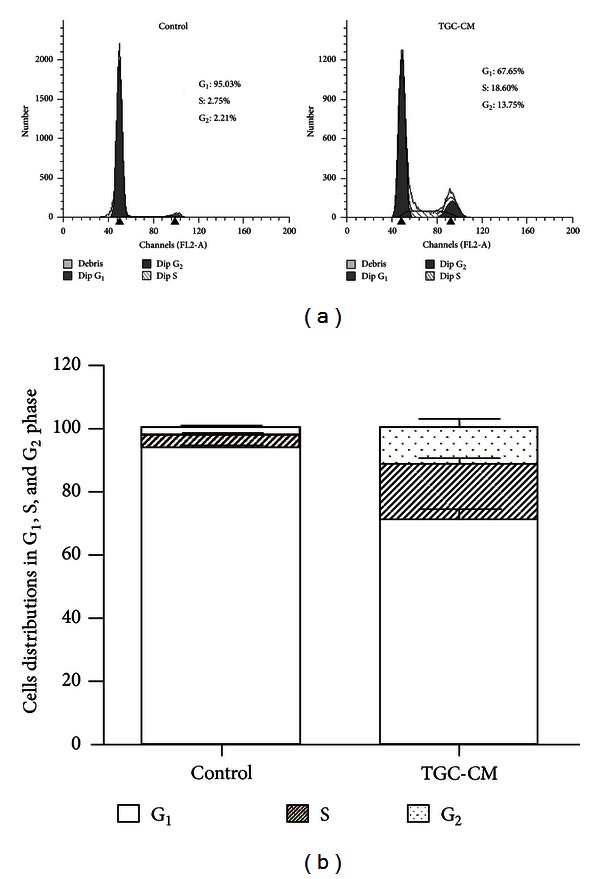
Figure 3.

Effects of TGC-CM on the cell cycle of hUCMSCs. (a) Representative cell cycle distributions of untreated hUCMSCs and hUCMSCs treated with TGC-CM are presented. (b) The column diagram shows the cell cycle distributions of untreated cells and cells treated with TGC-CM from three replicate experiments. P < 0.05.
