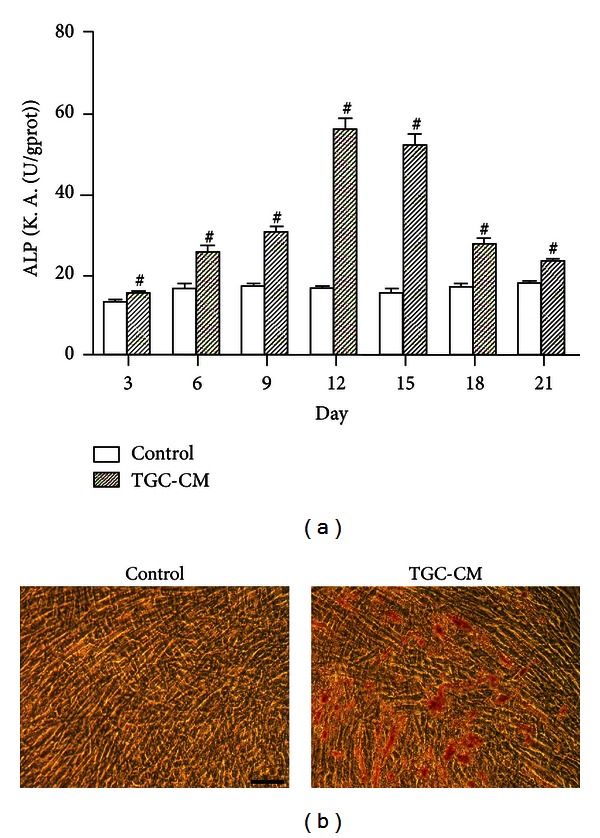
Figure 4.

The ALP activity and mineralization potential of hUCMSCs treated with TGC-CM. (a) The column diagram presents the ALP activity of untreated cells and cells treated with TGC-CM. Each experiment was performed in triplicate. The error bars represent the mean ± SD. # P < 0.001. (b) Human UCMSCs cultured in control medium were not positively stained with Alizarin Red S. The cells cultured in TGC-CM for 28 days formed calcium deposits, which were stained with Alizarin Red S. Scale bar = 100 μm.
