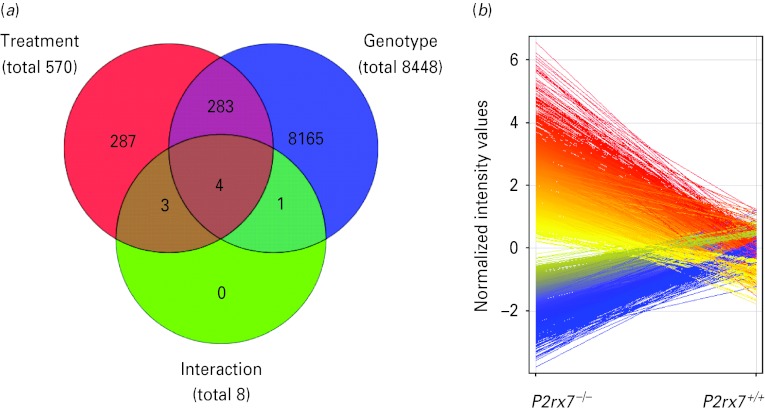
Fig. 6.
Summary of results of the whole genome microarray analysis performed on amygdala samples of P2rx7+/+ and P2rx7−/− mice subjected to saline or lipopolysaccharide (LPS) treatments (n = 4/group). (a) Venn diagram represents the main effects of the two-way analysis of variance with Benjamini–Hochberg's multiple correction comparison test for unequal replications and using the selection filters of >2.0-fold change: LPS treatment (red circle), genotype (blue circle) and their interaction (green circle). Numbers inside the compartments represent the number of transcripts that are significant for that effect. The intersections of the sets represent significantly changed genes for each of the effects involved in the intersection. Significance threshold was 0.05 and the p value computation was asymptotic. In the primary microarray analysis, the expression of a total of 8739 transcripts was found to be significantly altered with the applied statistical filters. These 8739 genes sum up from the genes significantly affected by treatment independently from genotype (287 + 283 = 570, illustrated by the numbers in those areas of the red circle, which is covered only by the red area, and covered by the red and blue areas), by genotype independently from treatment (8165 + 283 = 8448, illustrated by the numbers in those areas of the blue circle, which is covered only by the blue area, and covered by the red and blue areas) and by their interaction (4, as illustrated by the numbers within the intersection of the red/blue and green circles), i.e. 287 + 283 + 8165 + 4=8739. The intersection of the red and green circles represents three transcripts, which were not only significantly affected by LPS treatment but may also be altered by genotype, whereas the intersection of the blue and green circles represents one transcript, which is not only significantly affected by knockout genotype but may also be altered by LPS treatment. (b) Deficiency of the P2rx7 had the most profound effect on the expression profile, changing the expression of 8448 transcripts. Among them, 3133 were increased (red) and 5315 were decreased (blue), as illustrated by the deviation of the lines according to the normalized intensity values.

