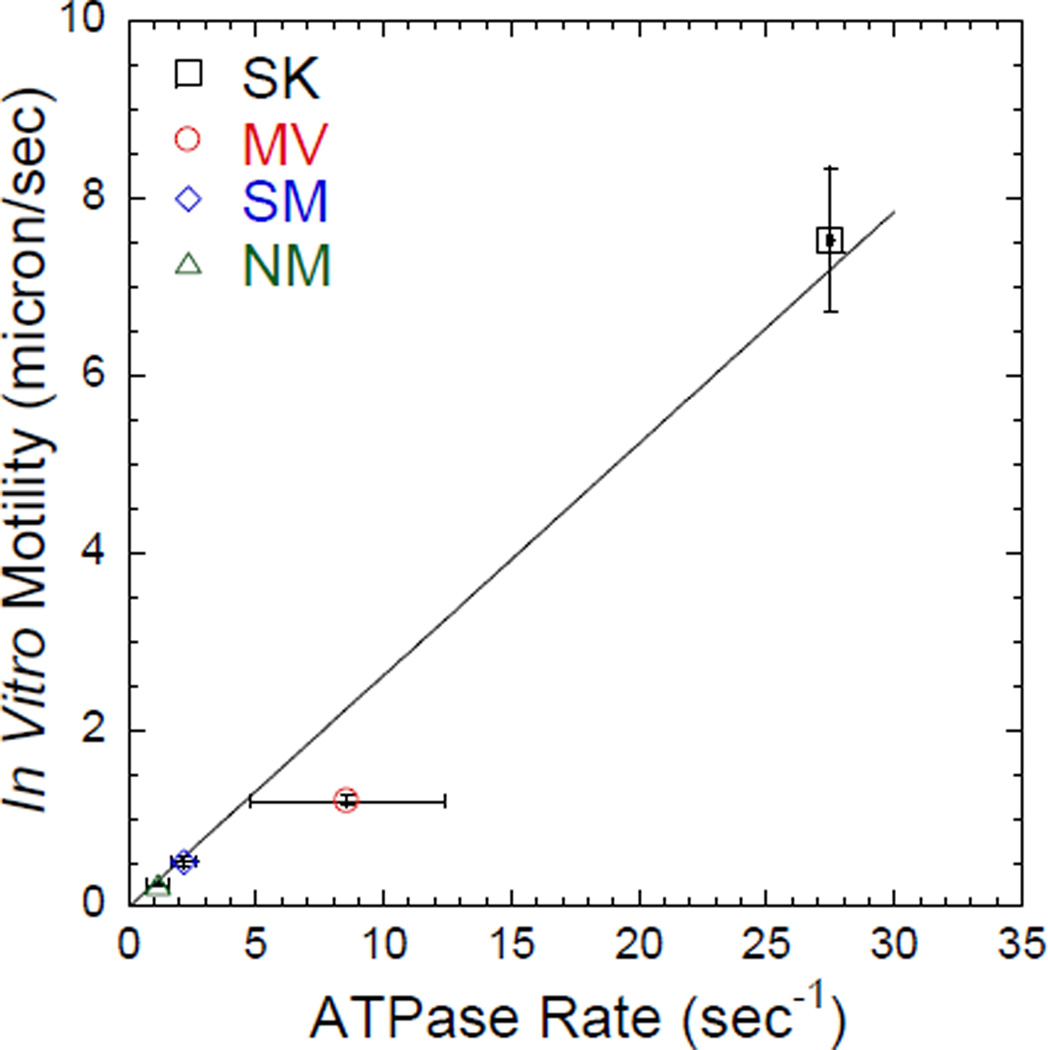
Figure 3. Correlation between ATPase activity and in vitro motility.
The sliding velocity in the in vitro motility assay (measured at 35–36 °C) is plotted as a function of actin-activated ATPase activity (measured at 35 °C). The error bars represent the standard deviation from 2–3 protein preparations. The data is fit with a linear regression (slope = 0.26 ± 0.02, R2 = 0.98) to demonstrate the correlation between ATPase activity and in vitro motility sliding velocity.

