
Figure 6.
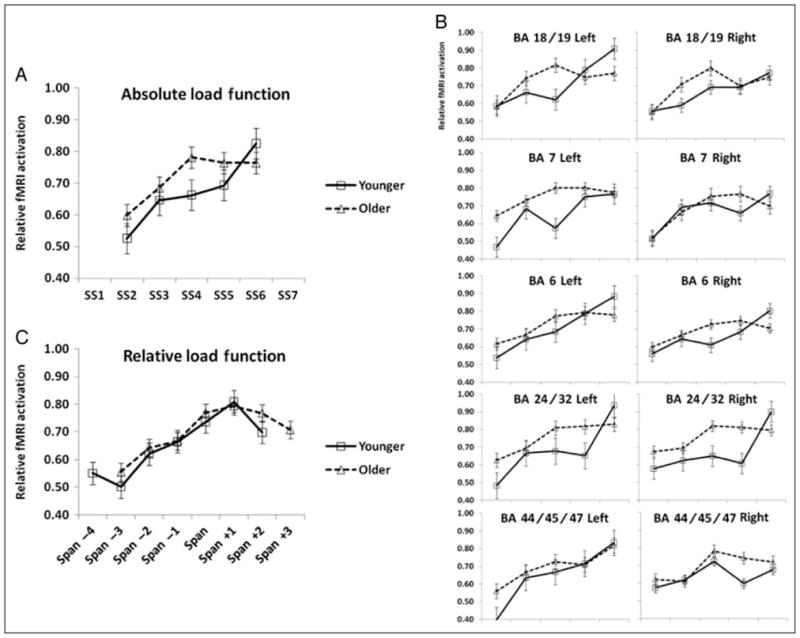
(A) Relative signal change of BOLD response as a function of set size, averaged across ROIs (peak values) in younger and older adults. (B) Relative signal change of BOLD response as a function of set size, separately for each ROI (peak values). (C) Relative signal change of BOLD response as a function of set size, averaged across ROIs (peak values), when WM load is adjusted as a function of each participant’s span.