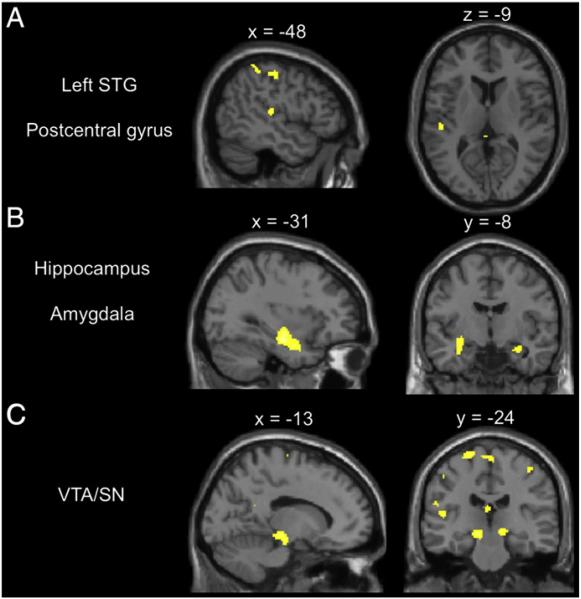
Fig. 3.
Interactions between group (AP vs. non-AP) and task (music vs. rest), showing increased activations in the AP group during music listening. Results are significant at the p<0.05 (cluster-corrected) level. A) Activations in the left superior temporal gyrus (x=–48, y=–24, z=–9) and postcentral gyrus (x=–48, y=–24, z=50). B) Additional activations in the hippocampus and amygdala (x=–31, y=–8, z=–21). C) Additional activations in the ventral tegmental area/substantia nigra of the midbrain (x=–13, y=–24, z=–12).

