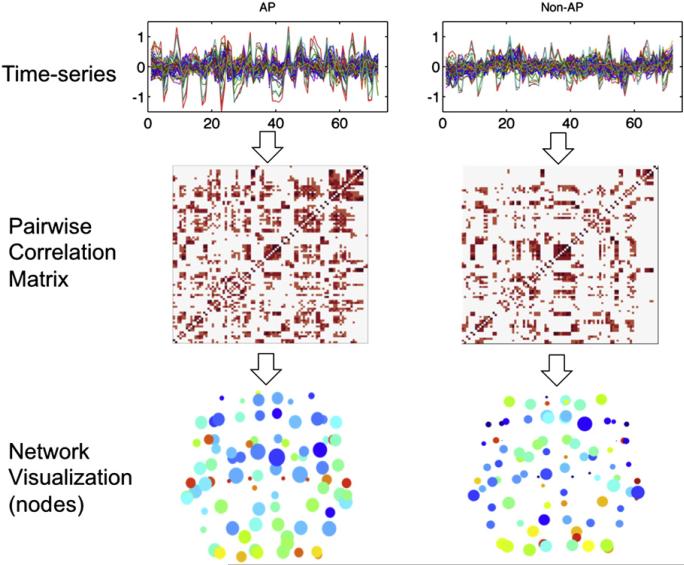
Fig. 4.
Network analysis pipeline for functional connectivity. Top: mean time-series data were obtained from fMRI scans of both AP and non-AP groups. Middle: Pairwise correlation matrices were obtained between every pair of regions from the modified AAL atlas. Bottom: Network statistics were calculated and visualized in brain space. Axial views of graphs obtained from both subject groups are shown here, with size of each node corresponding to degrees and color of each node corresponding to clustering coefficient.

