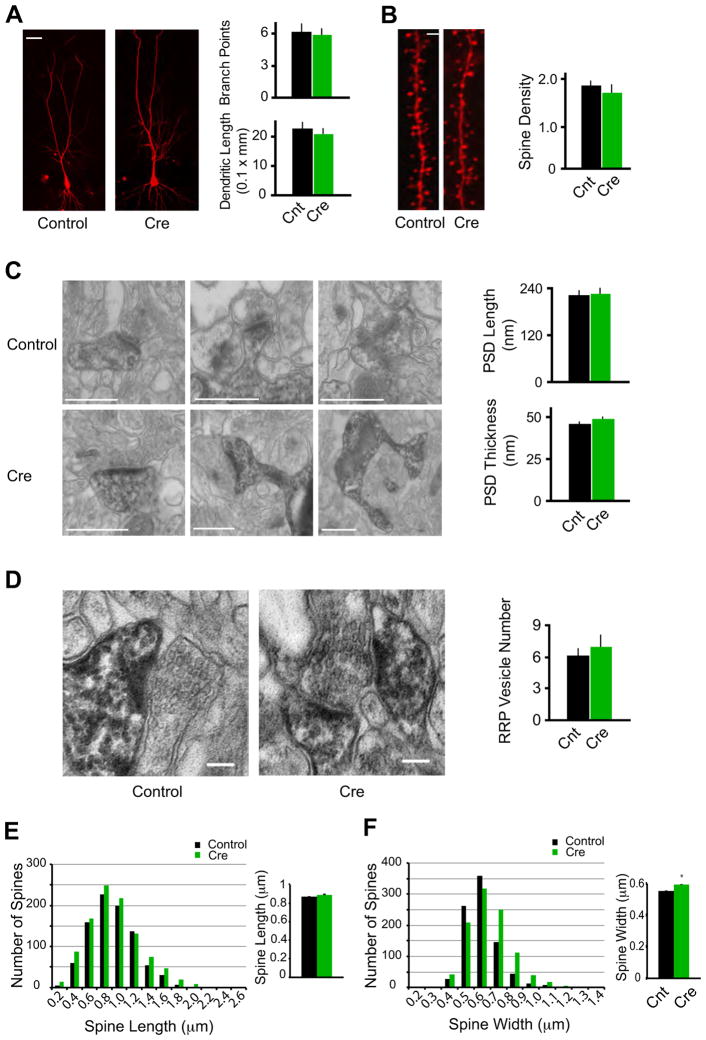
Figure 3.
Morphological conservation of CA1 pyramidal neurons devoid of synaptic excitation in vivo.
(A) Representative confocal stacks from Cnt and Cre cells. Bar graph in right shows average number dendritic branch points and dendritic length (Cnt: n = 10; Cre: n = 8; P > 0.05). Scale bar, 20 μm.
(B) Maximum intensity projections of representative dendrites from Cnt and Cre cells. Bar graph in right shows average spine density (the number of spines per micron) for Cnt and Cre neurons (Cnt: n = 7 neurons; Cre: n = 6; P > 0.05). Scale bar, 1 μm.
(C) Electron micrographs consistently reveal PSDs in spines from Cre-expressing cell, similar to Cnt cells. Bar graphs show no significant difference in PSD length or thickness between Cnt and Cre spines (Cnt: n = 33 spines; Cre: n = 40; P > 0.05). Scale bars, 500 nm.
(D) Pre-synaptic vesicle pools in boutons opposed to Cnt and Cre spines. Bar graph shows no significant difference in RRP vesicle numbers (Cnt: n = 15 spines; Cre: n = 15; P > 0.05). Scale bars, 100 nm.
(E–F) Histograms showing spine lengths (E) and widths (F) for all spines measured in confocal volumes of control (Black) and Cre-expressing (Green) neurons. In the bar graphs in the right, comparing the two conditions revealed no significant difference in mean spine length (E, Cnt: 0.87 ± 0.01 μm, n = 880; Cre: 0.88 ± 0.01 μm, n = 1021; P = 0.23), and a small but statistically significant increase in spine width in Cre-expressing neurons (F, Cnt: 0.55 ± 0.004 μm, n = 861; Cre: 0.59 ± 0.004 μm, n = 998; P < 0.01).

