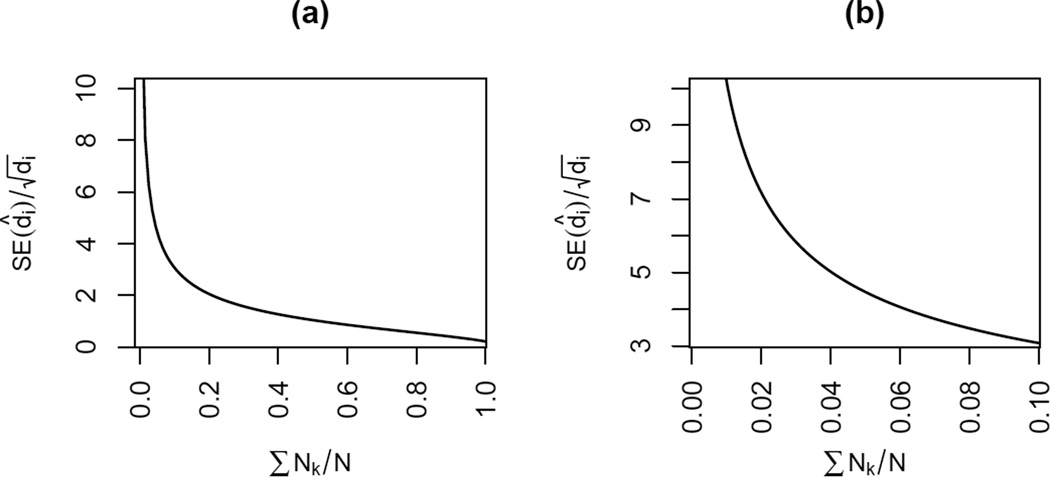
Figure 1.
Standard error of the simple scale-up degree estimate (scaled by the square root of the true degree) plotted against fractional subpopulation size. As we increase the fraction of population represented by survey subpopulations, the precision of the estimate improves, with diminishing improvements after about 20%.

