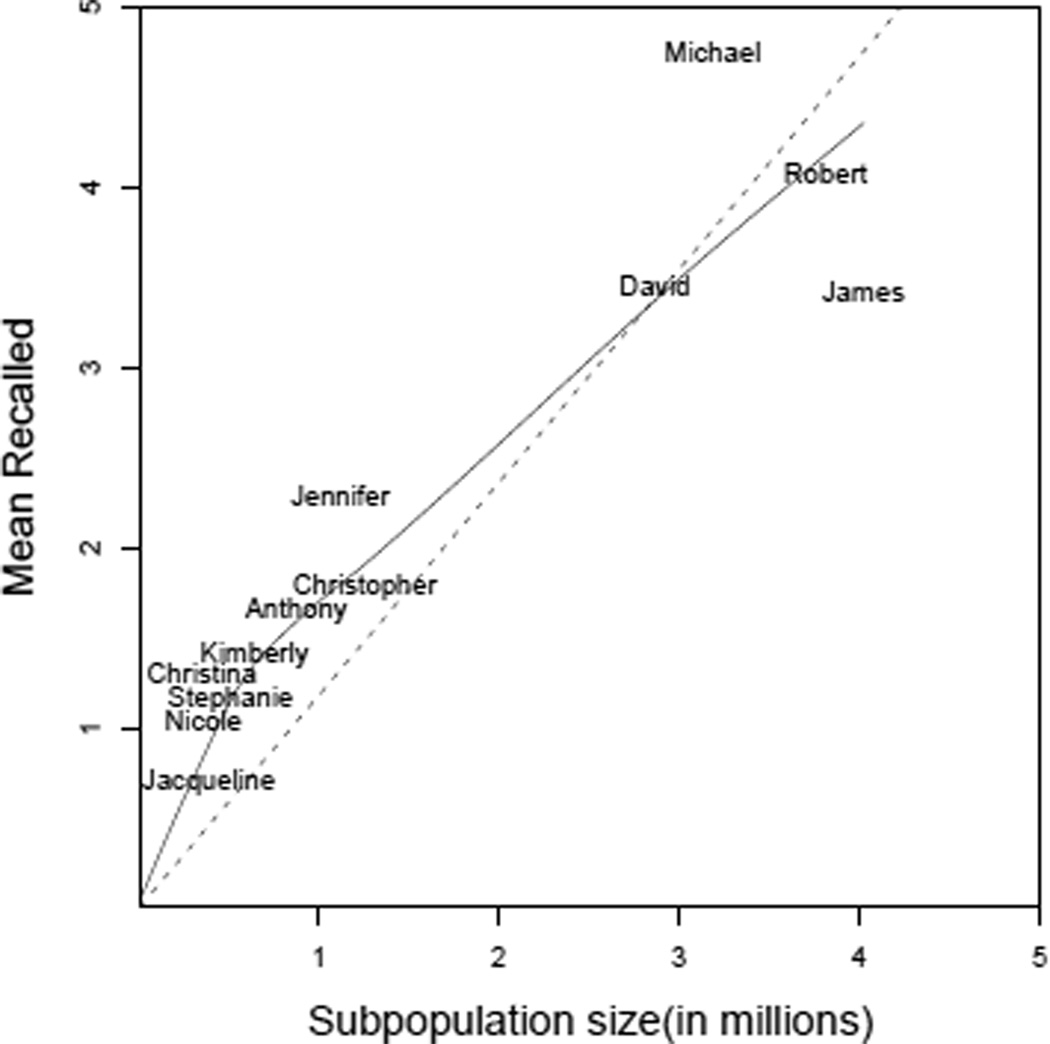
Figure 2.
Mean number recalled as a function of subpopulation size for 12 names. If respondents recall perfectly, then we would expect the mean number recalled to increase linearly as the subpopulation size increases. The best-fit line and loess curve show that this was not the case suggesting that there is recall error.

