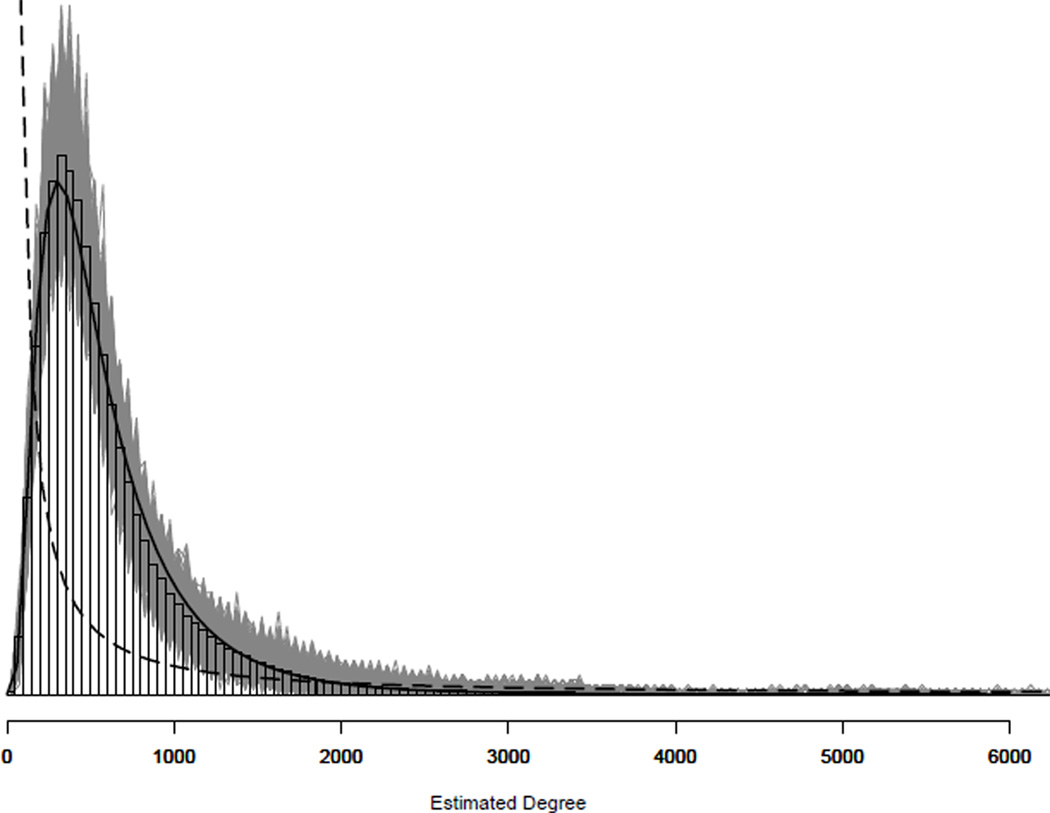
Figure 5.
Estimated degree distribution from the fitted model. The median is about 470 and the mean is about 610. The shading represents posterior simulation draws to indicate inferential uncertainty in the histograms. The overlay line is a log-normal distribution with parameters estimated via maximum likelihood using the observed data (μ̂mle = 6.2 and σ̂mle = 0.68). The dashed line is a power-law density with scaling parameter estimated via maximum likelihood (α̂mle = 1.28)

