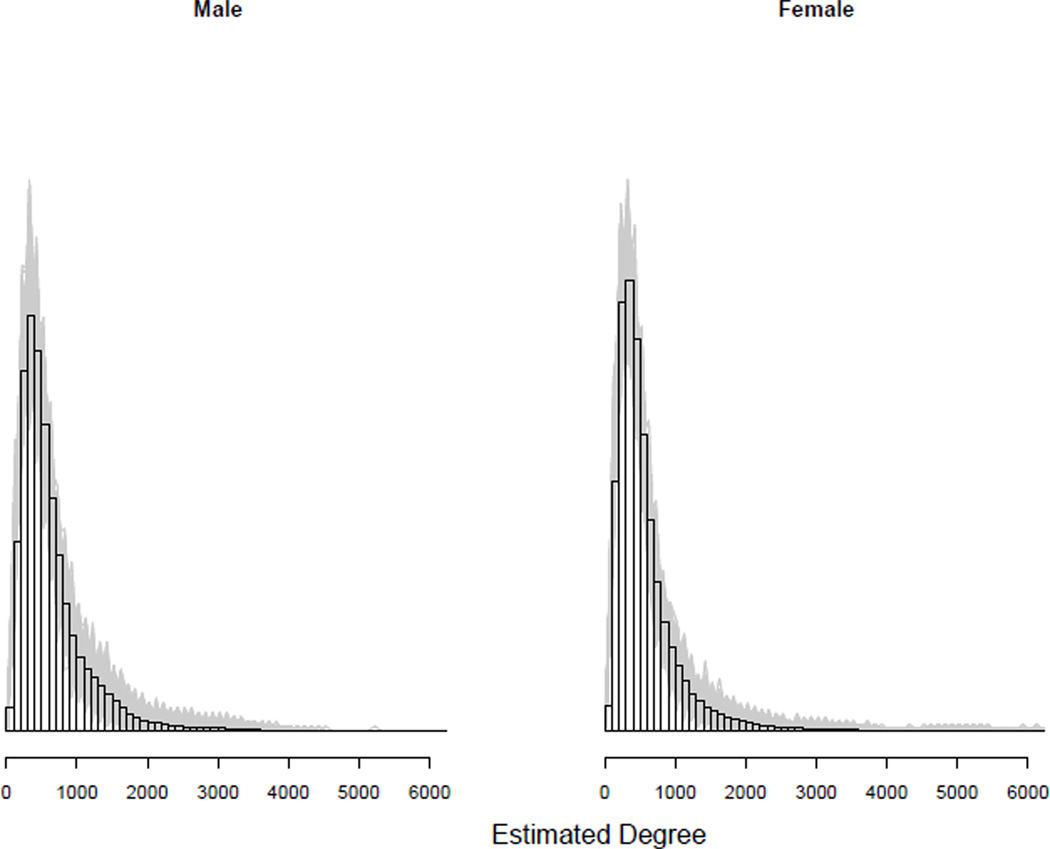
Figure 6.
Estimated degree distribution by gender. Shading represents simulation draws from the posterior and implies inferential uncertainty. The average degree for males is slightly larger than for females. For males the median is about 500 (mean 640) while the median for females is about 452 (mean 590).

