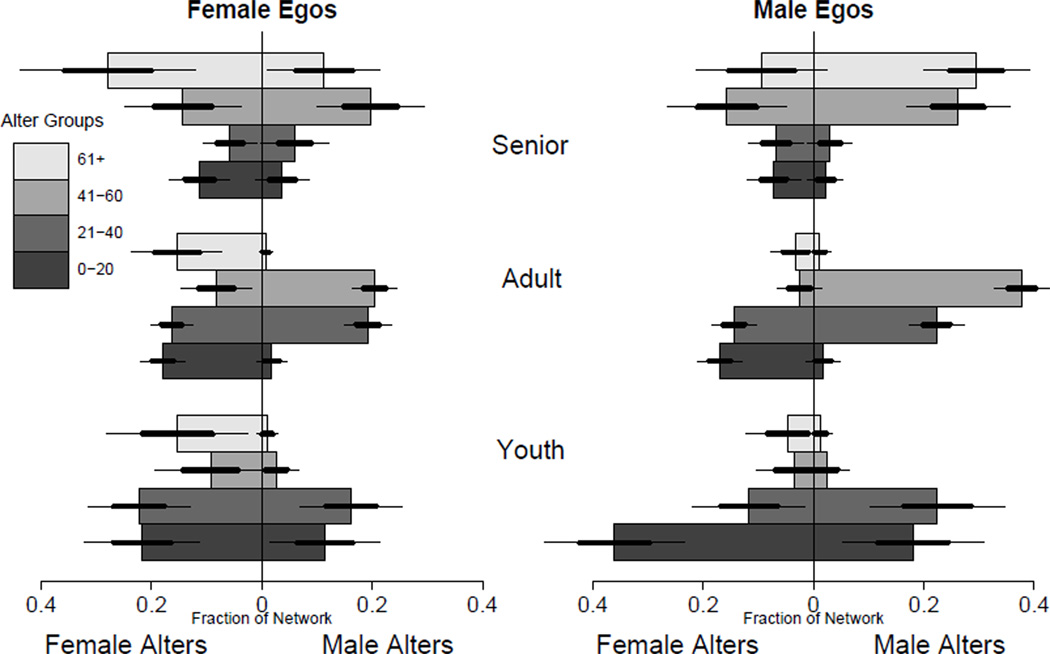
Figure 8.
Barplot of the mixing matrix. Each of the six stacks of bars represents the network of one ego group. Each stack describes the proportion of the given ego group’s ties that are formed with all of the alter groups; thus, the total proportion within each stack is 1. For each individual bar, a shift to the left indicates an increased propensity to know female alters. Thick lines represent +/− one standard error (estimated from the posterior) while thin lines are +/− two standard errors.

