
Figure 1.
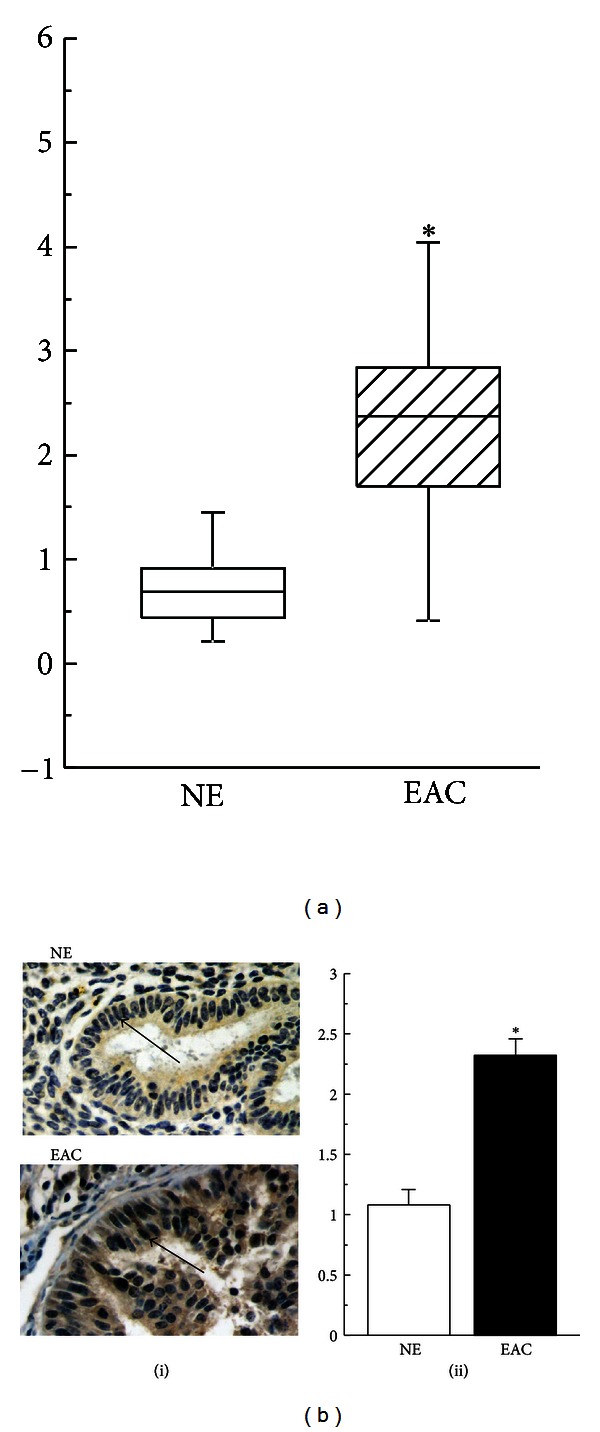
Overexpression of PARP1 protein and mRNA in EAC tissues. (a) Quantification of relative PARP1 mRNA levels. (b(i)) Sections were subjected to immunostaining for PARP1. Arrow denotes positive staining for PARP1 in the nuclei. (b(ii)) Summary of scoring the percentage of positive cells from the measurements shown in (b(i)). Bar graphs show mean ± SE. *P < 0.05 versus NE. Magnification is 400x. NE, normal endometrium; EAC, endometrial adenocarcinoma.