Figure 2.

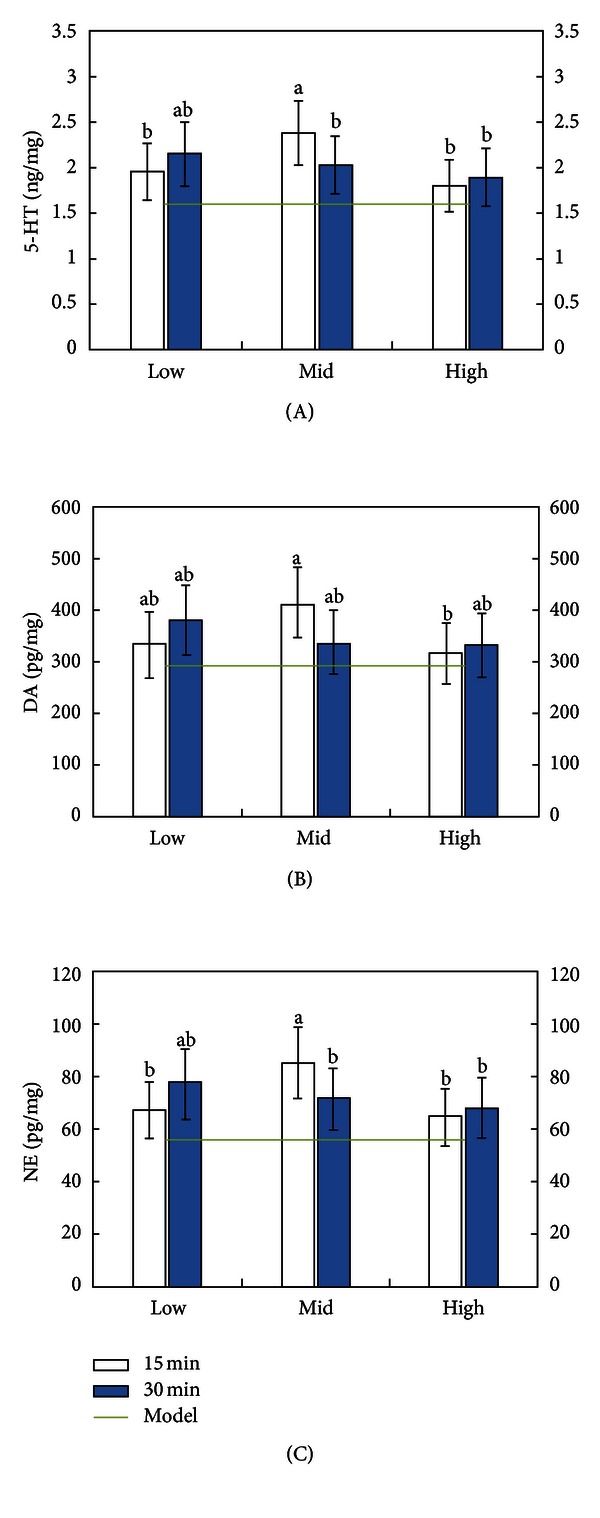
Cerebral levels of 5-HT (A), DA (B), and NE (C) of SAMP8 mice exposed to different concentrations of moxa smoke for various lengths of time. Note: any two groups without a common alphabet (a or b) are significantly different (P < 0.05).

Cerebral levels of 5-HT (A), DA (B), and NE (C) of SAMP8 mice exposed to different concentrations of moxa smoke for various lengths of time. Note: any two groups without a common alphabet (a or b) are significantly different (P < 0.05).