
Figure 2.
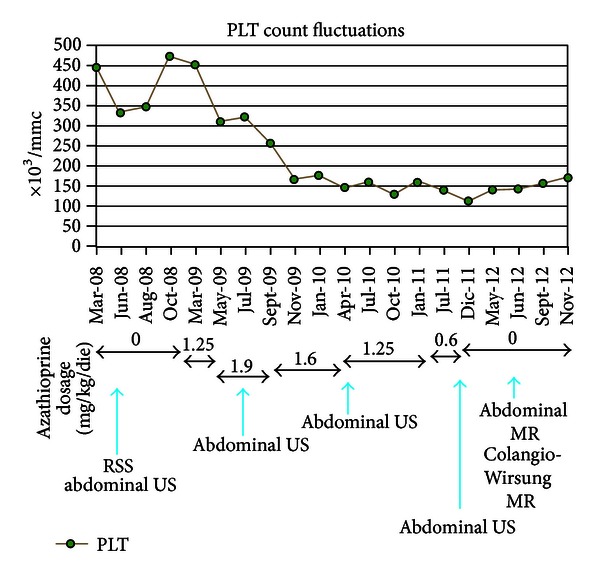
Platelets count fluctuations. The graphic shows platelets fluctuations from March 2008 to November 2012, in correspondence with therapy modifications: AZA dosage relating to each period is reported. The blue arrows show when instrumental investigations were performed. PLTs: platelets count; RSS: rectosigmoidoscopy; US: ultrasonography; MR: magnetic resonance.