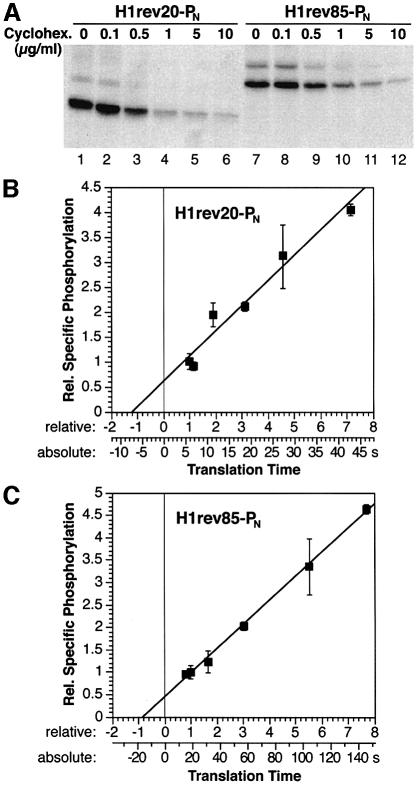
Fig. 6. Specific phosphorylation as a function of translation rate. (A) Elongation was reduced by incubation of transfected COS-1 cells with different concentrations of cycloheximide during 40 min of [35S]methionine labeling. Saponin extraction, immunoprecipitation and fluorography were then performed. (B and C) COS-1 cells expressing H1rev20-PN or H1rev85-PN were labeled with [35S]methionine and [32P]phosphate, saponin extracted, immunoprecipitated and analyzed by gel electrophoresis. The specific phosphorylation (average with standard deviation from three determinations each) normalized to that determined in the absence of inhibitor is plotted against the relative translation time of the N-terminal domain from the emergence of the phosphorylation tag to the appearance of a minimal signal (translation of 30 and 95 residues, respectively). The lower scale provides absolute times of translation for a translation rate of 5 amino acids/s.

An official website of the United States government
Here's how you know
Official websites use .gov
A
.gov website belongs to an official
government organization in the United States.
Secure .gov websites use HTTPS
A lock (
) or https:// means you've safely
connected to the .gov website. Share sensitive
information only on official, secure websites.
