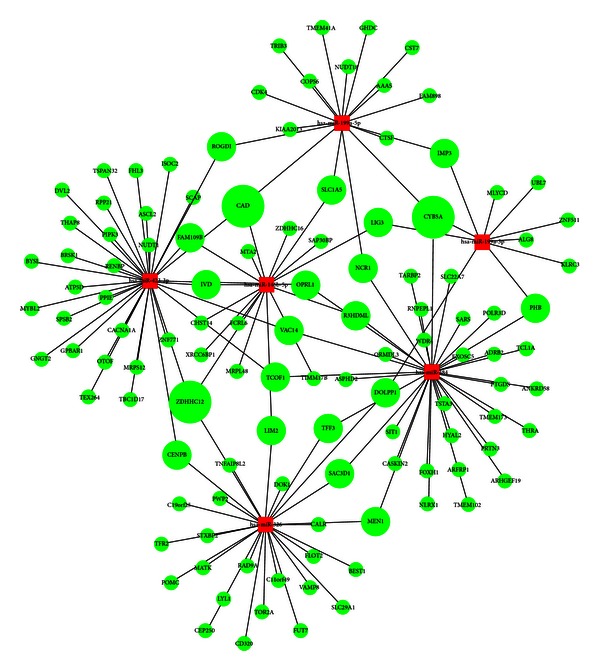
Figure 6.

The miRNA/mRNA interactive network. Round represented mRNAs and rectangular represented miRNAs. Red color indicated upregulation and green color downregulation, respectively. Sizes of the mRNAs were according to their degrees.

The miRNA/mRNA interactive network. Round represented mRNAs and rectangular represented miRNAs. Red color indicated upregulation and green color downregulation, respectively. Sizes of the mRNAs were according to their degrees.