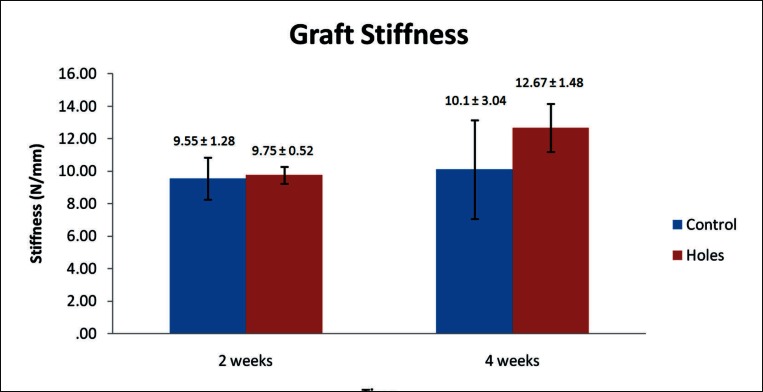
Figure 10.
Mean graft stiffness of control and experimental groups at two and four weeks post surgery. No significant difference was noted between the groups or within groups across time points. Graft stiffness decreased between two and four weeks in the control group while an increase was seen in the experimental group. Data is presented as mean ± standard error.

