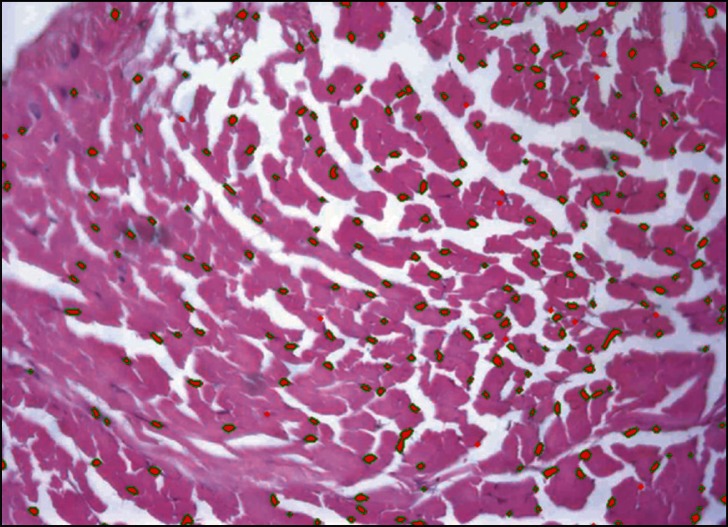
Figure 3.
ACL graft region of interest (one out of five) imported in the Bioquant software. Fibroblasts can be seen selected and highlighted in red color with green bordering. The cells were quantified for each ROI and the number of fibroblasts within one section of one specimen was estimated by the total number of cells within all five ROIs of that specimen.

