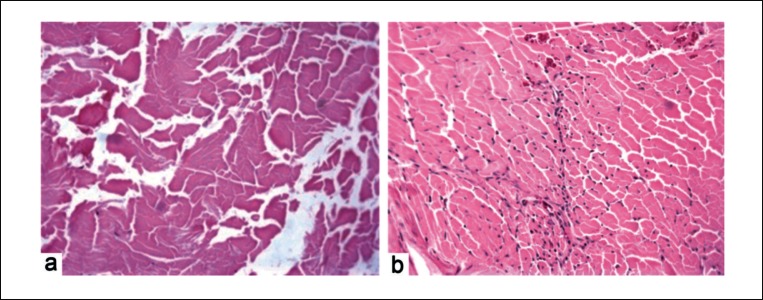
Figure 4.
Histology images (H&E staining) of tendon graft at one week post surgery. Control group (a) showed a necrotic graft while treatment group (b) showed a live graft, populated with cells (original magnification ×20). Significant difference was seen at one (p < 0.01) and two weeks (p < 0.05) post surgery.

