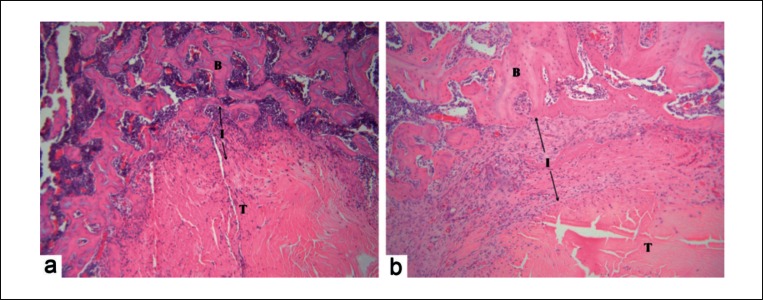
Figure 5.
Histology images (H&E staining) of tendon-bone interface at two weeks post surgery B = Bone, I = Interface, T = Tendon, arrows denote the width of the interface layer. No major differences were noted between the interface layer and newly formed trabeculae surrounding the tendon graft across specimens from the control group (a) and treatment group (b) (original magnification ×10).

