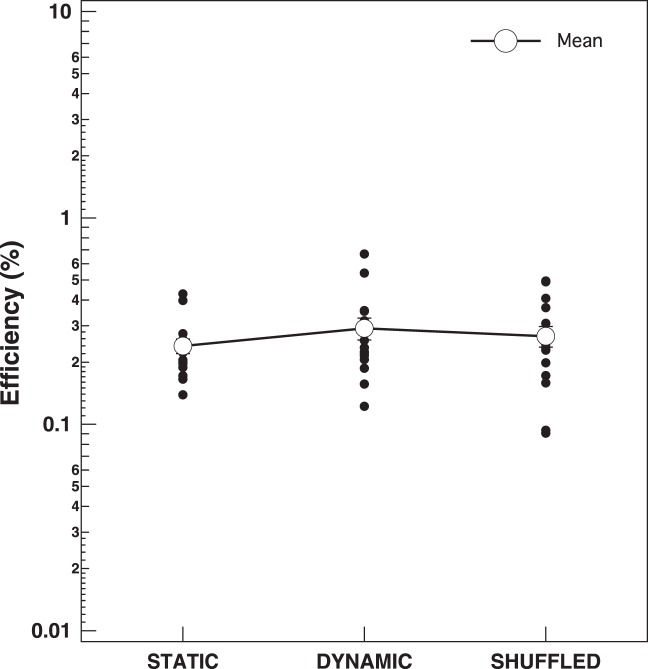
Figure 5.
Corresponding efficiencies (ideal/human contrast energy thresholds) for each human participant shown in Figure 4. Small closed circles correspond to efficiencies for individual observers; large open circles correspond to the mean efficiency across observers. Error bars on each mean correspond to ±1 SEM.

