Figure 10.
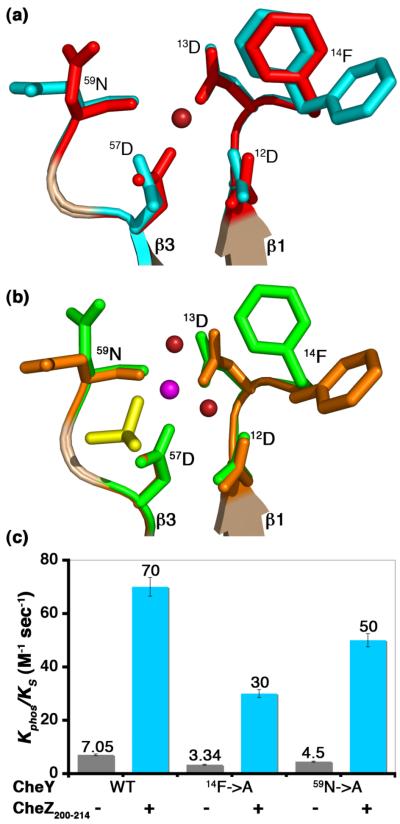
Role of key residues in peptide-induced acceleration of CheY phoshorylation. (a) Active site features of CheY in BeF3−-free F432YZ200-214 superimposed on inactive Mg2+-bound CheY. (b) Active site features of CheY in BeF3−-bound P2(1)2(1)2YZ200-214 superimposed on BeF3−-activated CheY. Key features in BeF3−-free F432YZ200-214 are shown in cyan, in BeF3−-bound P2(1)2(1)2YZ200-214 in orange, in inactive Mg2+-bound CheY in red and in BeF3−-activated CheY in green. The Mg2+ ion (magenta), water molecules (deep red) and the BeF3−species (yellow) at the active site are shown. The BeF3−-free F432YZ200-214 structure solved from a crystal grown in Tris (pH 8.4) is used as a representative of all F432YZ200-214 structures in (a). (c) Role of 14Phe and 59Asn. Rates of phosphotransfer to WT CheY, CheY14F→A and CheY59N→A proteins from ammonium phosphoramidate in the presence (+) and absence (−) of the CheZ200-214 peptide are shown as bars (see Materials and Methods). Each rate corresponds to an average from three independent experiments with standard errors indicated.

