Figure 3.
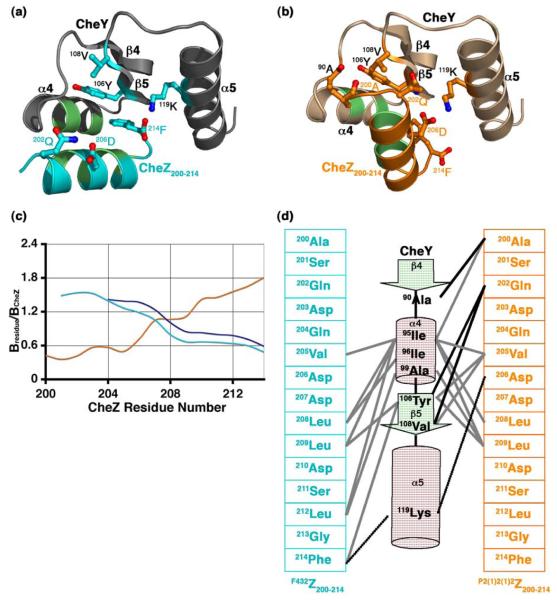
The CheZ200-214 peptide-CheY interface. Ribbon representation of (a) the F432YZ200-214 interface and (b) the P2(1)2(1)2YZ200-214 interface. The side chains of key contacting residues are illustrated as ball and stick models and hydrophobic contacts are shown as light green patches. (c) Relative B-factors of CheZ200-214 in the CheY-CheZ200-214 structures. The relative B-factor versus CheZ residue number plot in BeF3−-free F432YZ200-214 is shown in cyan, that in BeF3−-bound F432YZ200-214 in deep blue and that in BeF3−-bound P2(1)2(1)2YZ200-214 in orange. Bresidue is the overall B-factor for each residue and BCheZ is the overall B-factor for all atoms of CheZ200-214 included in the final model. (d) Schematic representation of the CheY-CheZ200-214 contacts. The F432Z200-214 primary sequence in cyan and the P2(1)2(1)2Z200-214 primary sequence in orange are shown on either side of the C-terminal half of CheY, represented in secondary structural elements. Participating residues are highlighted. Hydrophobic contacts are illustrated as solid grey lines, salt bridges as dashed black lines and hydrogen bonds as solid black lines. The BeF3−-free and BeF3−-bound F432YZ200-214 structures solved from crystals grown in Tris (pH 8.4) are used as representatives of F432YZ200-214 structures in this figure.

