
Figure 7.
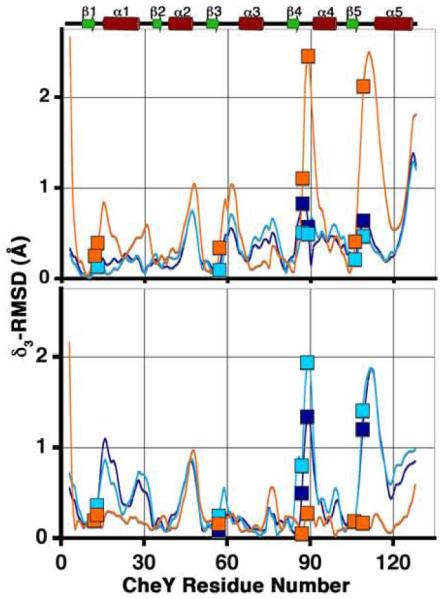
Comparison of the CheY backbone conformations in the CheY-CheZ200-214 complexes with those in inactive and active CheY. plots are shown for main chain atoms of CheY in BeF3−-free F432YZ200-214 (cyan), BeF3−-bound F432YZ200-214 (deep blue) and BeF3−-bound P2(1)2(1)2YZ200-214 (orange) following “sieve-fit” superposition with inactive Mg2+-bound CheY (2CHE)14 (upper panel), resulting in overall r.m.s.d. values of 0.50 Å, 0.48 Å and 0.98 Å, respectively and with BeF3−-activated CheY (1FQW)15 (lower panel), resulting in overall r.m.s.d. values of 0.80 Å, 0.77 Å and 0.35 Å, respectively. The BeF3−-free F432YZ200-214 and the “meta-active” conformer of the BeF3−-bound F432YZ200-214 structures solved from crystals grown in Tris (pH 8.4) were used for and r.m.s.d. calculations, shown here. Key active-site and switch residues are highlighted on the plots by square symbols. The secondary structure of CheY is plotted for reference.