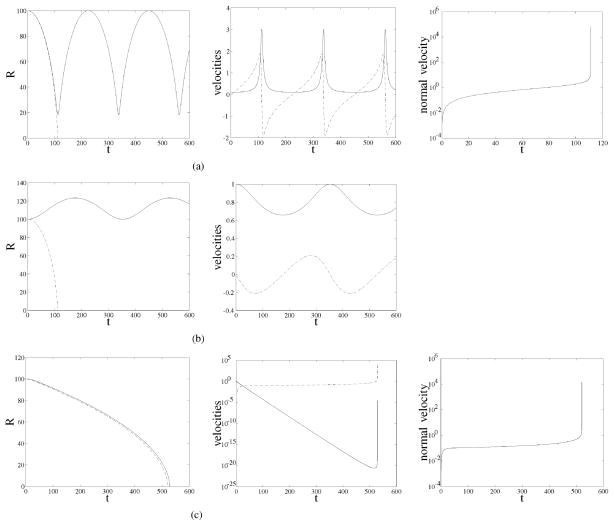
Fig. 5.
Left column: Evolution of the radius for the normal velocity evolution (dashed line) and the full velocity evolution (solid line). Middle column: Evolution of normal velocity (dashed line) and tangential velocity (solid line) for the full velocity approach. Right column: Evolution of normal velocity for the normal velocity evolution. (a) α0 = 0.1, β0 = 0, R0 = 100, γα = 0, γβ = 0. (b) α0 = 1, β0 = 0, R0 = 100, γα = 0, γβ = 0. (c) α0 = 1, β0 = 0, R0 = 100, γα = 0.1, γβ = 0.1.

