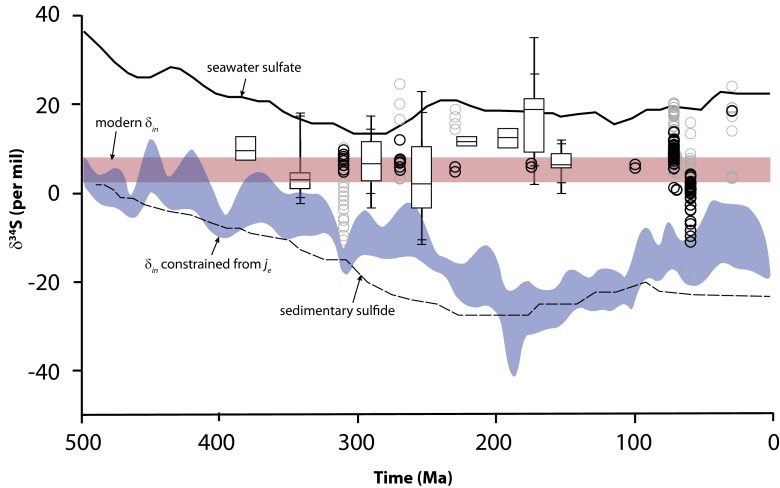
Fig. 2.
Various aspects of the evolution of the sulfur cycle through most of the Phanerozoic Eon. The evolution of the δ34S of seawater sulfate and average values for the δ34S of pyrite sulfur are shown. The trends are redrawn from ref. 12, with permission from AAAS. Model results for the evolution of the isotopic composition of sulfur input to the oceans δin are shown assuming sulfate burial constraints from the macrostratigraphic database. The variability in model results comes from different assumptions about the burial fluxes of pyrite sulfur, jpy. These results are redrafted from ref. 12. Overlain is the isotopic compositions of sulfur in coal through time. Data from China are presented as box plots showing 5th, 10th, 25th, 50th, 75th, 90th, and 95th percentile uncertainties. For these data, the isotopic composition of total sulfur is plotted. The other data, plotted as circles, represent the isotopic composition of organic sulfur, with low-sulfur coals (<1 wt % total S) plotted as black circles. Coal data come from refs. 13, 30, 32, 33, 36, and 37.

