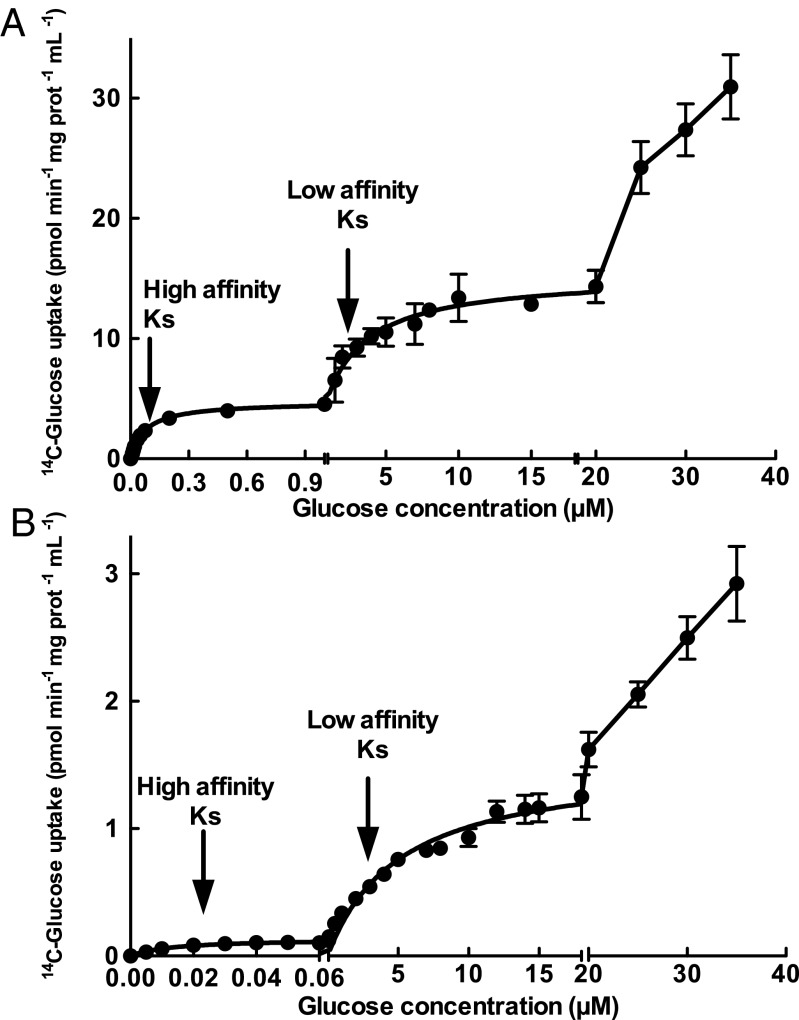
Fig. 4.
14C-Glucose concentration versus its uptake in cultures of P. marinus sp. SS120 (A) and Synechococcus sp. WH7803 (B). The scale used in the y axis is different to allow a proper representation of results. Data presented are the average of three independent biological replicates. Bars show SD for each sample.

