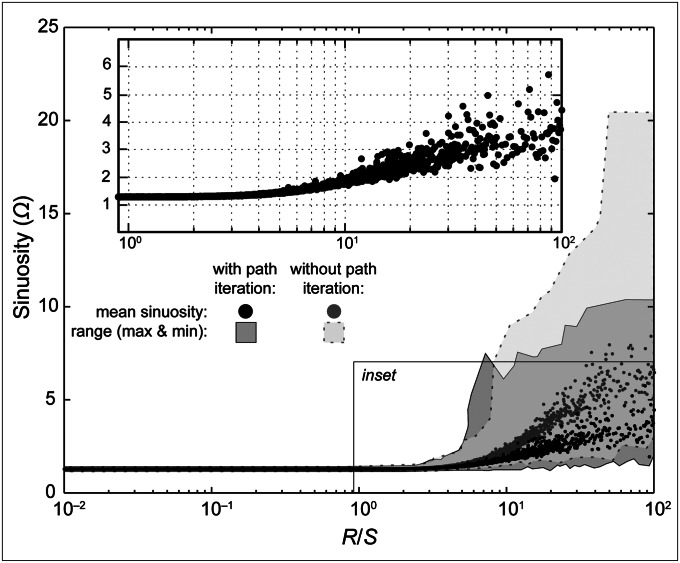
Fig. 2.
Semilog plot showing ensemble results of modeled sinuosity (Ω) versus relative resistance (R/S). Shaded regions illustrate the range (maxima to minima) of sinuosities produced by the model with (dark region) and without (light region) the iteration rule to shorten supersinuous paths. Black dots and gray dots show the mean sinuosities for both cases, respectively. Inset shows in greater detail mean sinuosities generated with the iteration rule. Additional statistical properties of the model are provided in Fig. S3.

