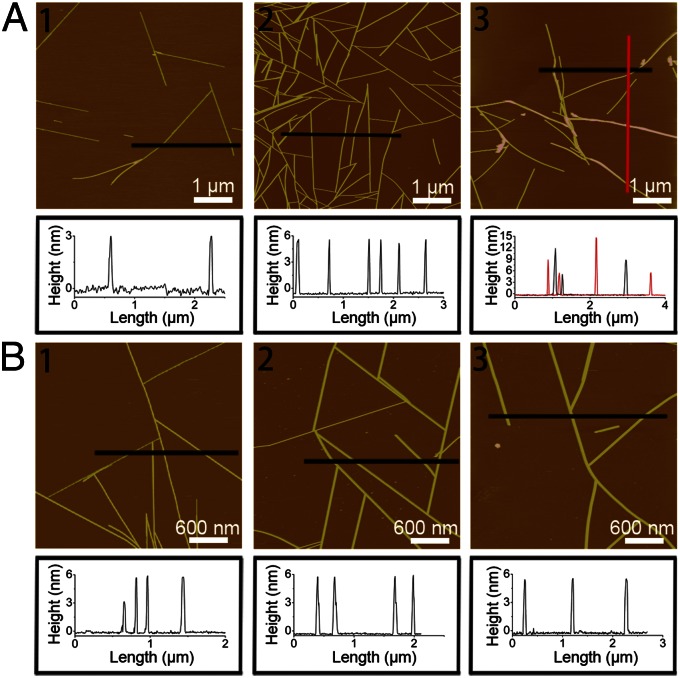
Fig. 5.
AFM height images and section analysis of the GAV-9 assemblies under aqueous solutions containing different concentrations of MgCl2: 5 mM (A1), 100 mM (A2), and 250 mM (A3), respectively. AFM height images and section analysis of the GAV-9 assemblies under aqueous solutions containing 100 mM NaCl (B1), 100 mM KCl (B2), and 100 mM MgSO4 (B3), respectively.

