Fig. 6.
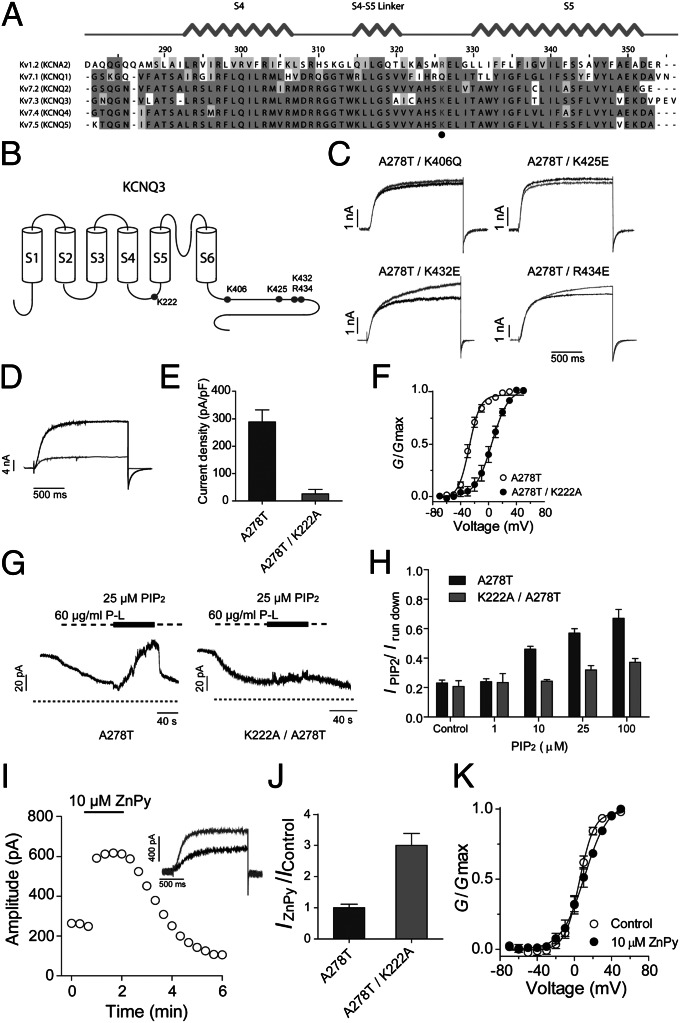
Identification of a unique PIP2 binding site that determines KCNQ3 sensitivity to ZnPy. (A) Alignment of S4–S5 linker of Kv1.2 and KCNQ1 to KCNQ5. The highly conserved positive-charged residues for PIP2 binding are highlighted in gray. (B) Cartoon shows the position of reported PIP2 binding sites and K222 in the KCNQ3 channel. (C) Four KCNQ3 mutants as indicated lack sensitivity to 10 μM ZnPy. Black line indicates control and gray line indicates currents in the presence of 10 μM ZnPy. Testing potential is +50 mV. (D) Representative traces of KCNQ3 A278T (black) and A278T/K222A (gray). (E) Current density of KCNQ3 A278T and K222A/A278T. (F) G-V curves of the KCNQ3 A278T and A278T/K222A. (G) Representative traces of inside-out patch recording showing PIP2 sensitivity of KCNQ3 A278T and K222A/A278T. Experiments were performed in inside-out patch in oocytes. Application of poly-lysine (P-L) 60 μg/mL inhibits the currents of both A278T and A278T/K222A. (H) Histograms show phosphatidylinositol diC8 dose–response of A278T and A278T/K222A. Irun down is the current amplitude at end of application of poly-lysine. (I) Time course of ZnPy potentiating A278T/K222A. Inset: representative traces in the presence (gray) or absence (black) of 10 μM ZnPy. (J) Summary of 10 μM ZnPy on A278T/K222A amplitude (n > 5). Testing potential is +50 mV. (K) G-V curves of A278T/K222A with and without ZnPy (n > 5).

