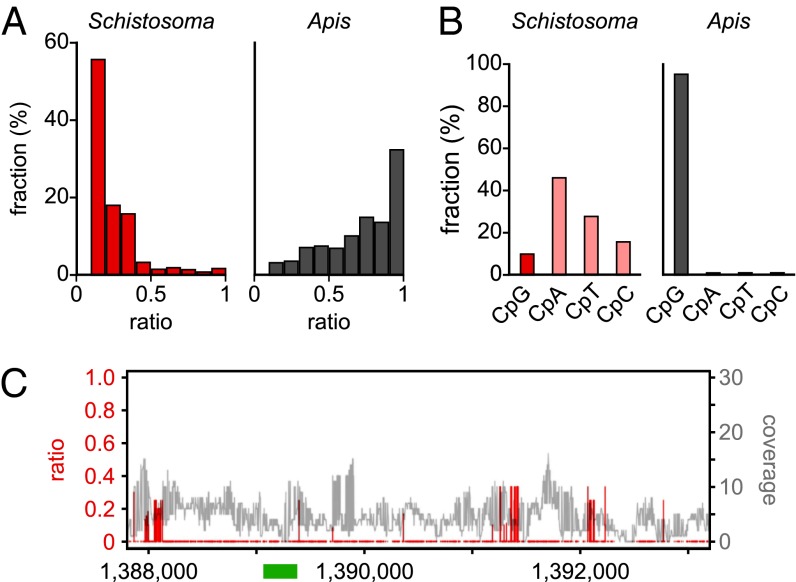
Fig. 1.
Characterization of the Schistosoma mansoni methylome. (A) Average methylation levels were determined for all cytosine residues with a methylation ratio >0.1 and then distributed into bins with increasing methylation ratios (red bars). For comparison, the corresponding data are also shown for honey bee worker brains (gray bars), an established Dnmt1/3-dependent methylome with a very low DNA methylation level (30). (B) Dinucleotide sequence contexts of unconverted cytosines in Schistosoma (red) and in honey bees (gray). (C) Position-specific nonconversion ratios (red) and coverages (gray) of the Schistosoma forkhead gene. The specific region previously reported to be methylated (23) is indicated as a green bar. Sequence position numbers refer to GenBank accession JF781495.

