Fig. 2.
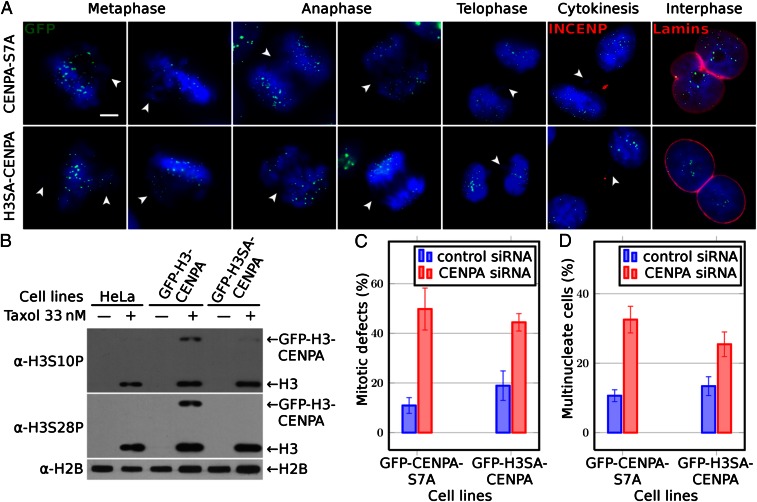
Both nonphosphorylatable NH2-tail mutants GFP–CENP-A–S7A and GFP–H3SA–CENP-A are unable to rescue the CENP-A knocked down cell phenotype. (A) Cell cycle microscopy visualization (after CENP-A suppression by siRNA treatment) of HeLa cells stably expressing siRNA-resistant either nonphosphorylatable NH2-tail GFP–CENP-A–S7A (first row) or GFP–H3SA–CENP-A (second row) mutants. GFP fluorescence was used for the visualization of CENP-A. An antibody against INCENP and antilamina antibody was used to detect the midbody during cytokinesis and the nuclear envelope in interphase cells, respectively. Blue, DNA; white arrowheads point to misaligned or lagging chromosomes and to chromatin bridges. (Scale bar, 5 µm.) (B) Phosphorylation status of both GFP–H3–CENP-A and GFP–H3SA–CENP-A fusions visualized by antibodies against histone H3 phosphorylated either at serine 10 or at serine 28; antihistone H2B antibody was used to show that equal amounts of proteins were loaded. Types of cells used are indicated (Upper). Arrows indicate the positions of the GFP fusions or histone H3. (C) Histograms showing the percentage of mitotic defects at 72 h posttransfection with siRNA against CENP-A in the indicated cell lines. (D) Same as C, but for the percentage of multinuclear cells. For each experiment at least 400 cells were counted. Data are means and SEM of five independent experiments.

