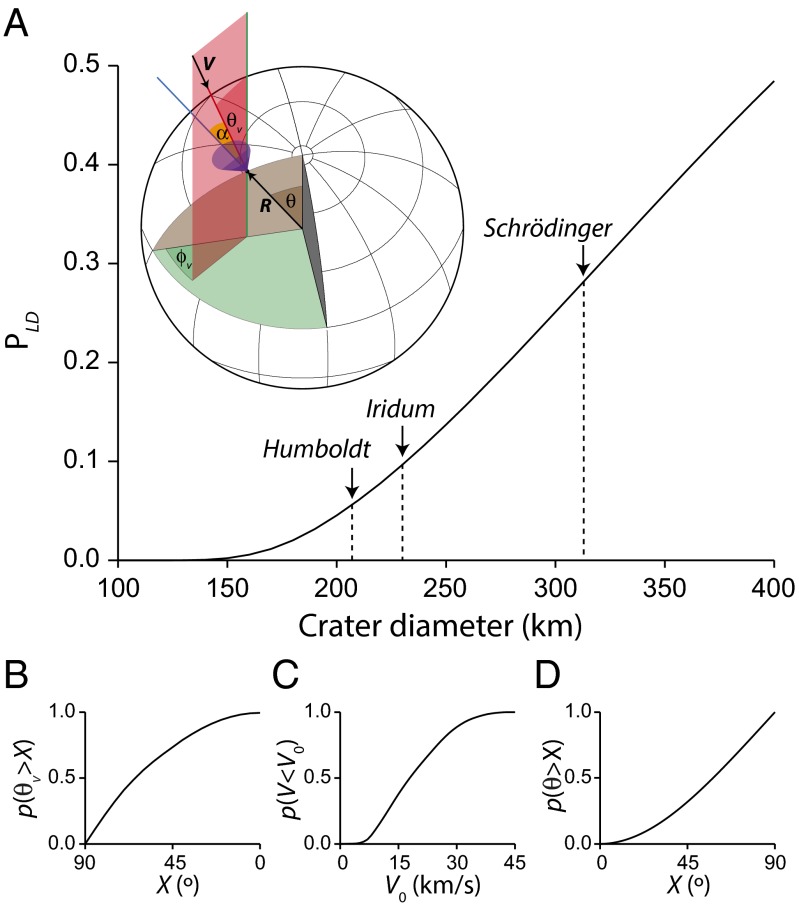
Fig. 4.
(A) Probability to have induced a libration dynamo as a function of crater diameter. The diameters of the Late Imbrian crater Humboldt and Early Imbrian craters Iridum and Schrödinger are shown. (Inset) Impact geometry. The red line is the impact trajectory; the red surface is the plane defined by the impact trajectory and a line parallel to the lunar spin axis at the impact location. The blue line is the local vertical. The purple cone represents trajectories with α > 80°. (B) Cumulative probability distribution for the inclination of the impact trajectory, θv (45). (C) Cumulative probability distribution for the impact velocity, V (37). (D) Cumulative probability distribution for the impact location colatitude, θ (45).

