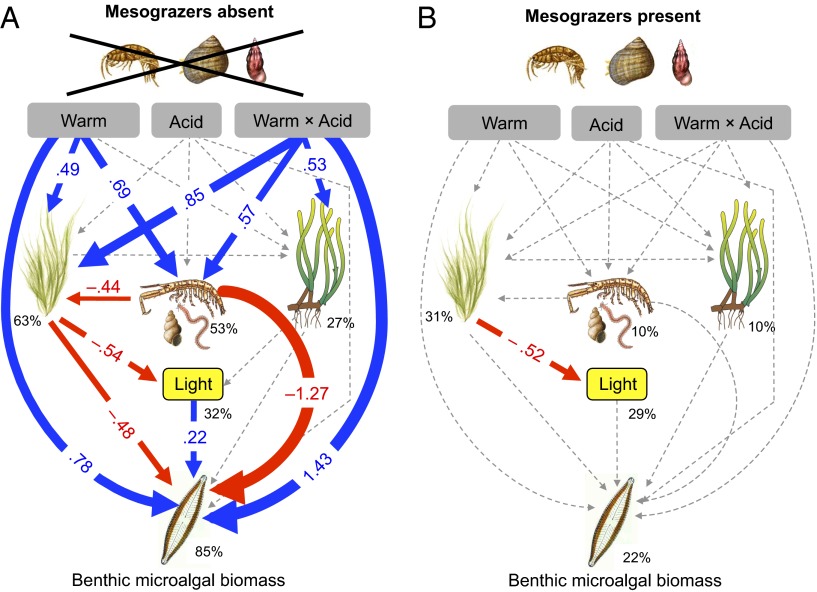
Fig. 2.
Path diagrams showing how experimental warming (Warm), acidification (Acid), and the interaction between warming and acidification (Warm × Acid) affect the macroalgae, sediment-associated fauna, Z. marina, light, and benthic microalgal biomass. Path diagram represents (A) seagrass meadows with mesograzers (G. locusta, L. littorea, and Rissoa sp.) absent and (B) seagrass meadows with mesograzers present. Solid paths (blue positive and red negative effects) are statistically significant (P < 0.05) whereas the dashed lines are not. At each significant path the standardized coefficients are represented and interpreted as follows: If, for example, Warm × Acid goes up by 1 SD, the benthic microalgae biomass goes up by 1.43 SD. Standardized coefficients are therefore used to compare the strength of direct vs. indirect effects. Percentages indicate the variance explained by the model.

