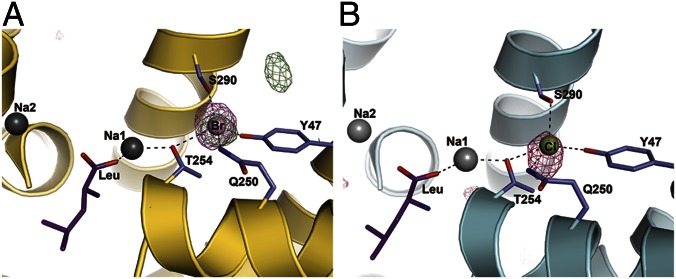
Fig. 3.
The substrate and ion binding sites in the two structures. (A) The substrate and ion binding sites in the LeuT-E290S-Br− structure. Na+ ions are shown as gray spheres, and Br− ions are shown in light pink. The bound Leu is shown as purple sticks, whereas the Br− coordinating residues are depicted as slate sticks. A simulated annealing omit map at a 4.5σ contour level obtained from refined coordinates in the absence of the Br− ion is shown as a pink mesh, confirming the position of the bound Br− ion. An isomorphous difference map between LeuT-E290S-Br− and 3GJC (18) is displayed at 4.0σ contour level (green mesh). The strongest positive peak is found at the position of Br− in the Cl− site in chain B. The adjacent peak is caused by a side chain shift in Phe31 (Fig. S3). (B) The substrate and ion binding sites in the LeuT-E290S-Cl− structure. The Na+ ions, the substrate, and coordinating residues are depicted as in A. Cl− is shown as a green sphere. The pink mesh depicts a simulated annealing omit map at a 3.0σ contour level produced from the refined coordinates in the absence of the Cl− ion.

