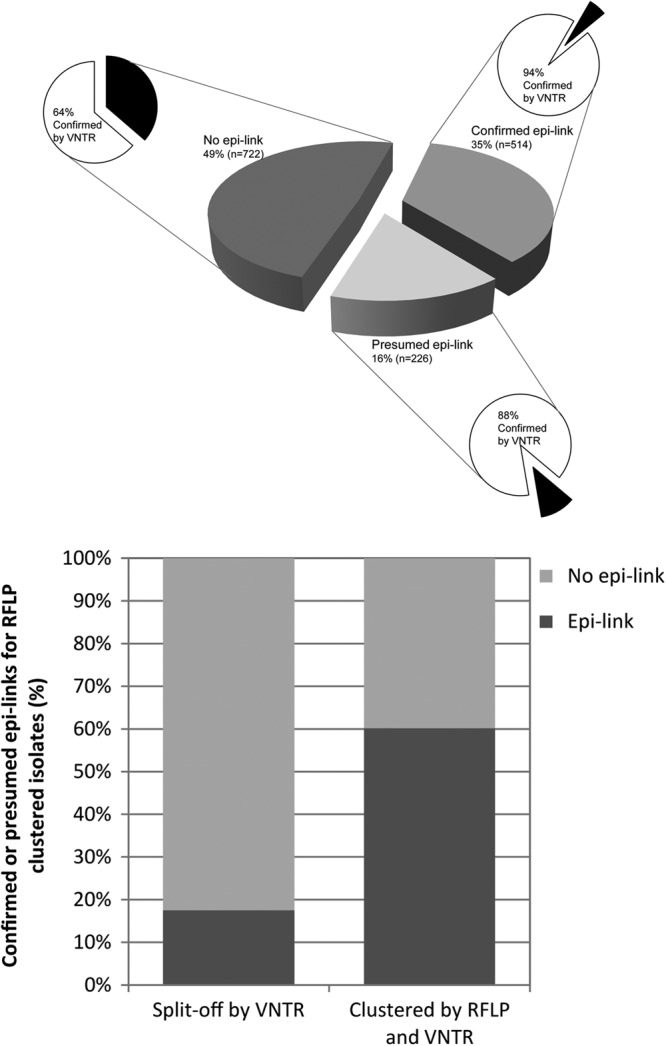
Fig 3.

(Top) RFLP-clustered isolates (n = 1,462) divided by cluster investigation results, classified as confirmed, presumed, and no epidemiological link. For each segment, the distribution of confirmed clustering by VNTR typing is shown. (Bottom) Percentages of confirmed or presumed epidemiological links for RFLP-clustered cases. Isolates with and without VNTR-supported clustering.
